In the previous part of this workshop, we went through the steps needed to massage our data set into something we want to lay out in a map that looks something like this: https://nostalgic-lumiere-190119.netlify.app/
Maps and data
Let’s skip forward to the end goal, seeing this data as a map. We’re going to use a JavaScript package called Leaflet.js, which will do pretty much all the work in rendering up a map in the browser. All we have to do is tell it where in the world it is drawing the map of, how zoomed in we want to be and, most importantly for us, any markers for features we want on the map.
There’s a GitHub repository with the required files in it at https://github.com/Extra3T/MapDemo. Clone or download this into a local directory and then try serving that directory as a local static website. If you have Python on your system, that’s as simple as changing directory to the cloned files and running “python3 -m http.server”:
$ python3 -m http.server
Serving HTTP on :: port 8000 (http://[::]:8000/) ...
Then go to localhost:8000 in your web browser and you should see a map. It’s completely lacking any pub markers. It’s just a plain empty map.
Talking GeoJSON
Now Leaflet.js accepts that marker data in a number of formats. For this example, we’re going to use GeoJSON, a format that wraps geographic data in JSON. Here’s a snippet of GeoJSON for representing a pub:
{
   "type" : "Feature",
    "geometry" : {
        "type" : "Point",
        "coordinates" : [
            -1.583017,
            54.612484
        ]
    },
    "properties" : {
        "name" : "124 Recovery Company",
        "area" : "County Durham",
        "pub_count" : 649.0
    }
},
It is tagged with a type, in this case it’s a “Feature” and then there’s a “geometry”, which in this case is of type “Point”. That means it’s a single coordinate, stored as an array of two decimal numbers. There’s also a properties section which contains ad-hoc names and values of associated information with that point. If you take JSON objects like this and wrap them in a GeoJSON FeatureCollection they become a self-contained file of GeoJSON data. We’ll cover that step later, but right now, we need to turn our list of pubs into GeoJSON features.
For that we need to return to the aggregation we were building in part 1 and add one more stage.
5: Projecting GeoJSON
The simplest way to reshape the map data into some MongoDB GeoJSON is with a $project stage. This will be the last stage.
{
    "_id" : 0.0,
    "type" : "Feature",
    "geometry" : {
        "type" : "Point",
        "coordinates" : [
            "$pub.longitude",
            "$pub.latitude"
        ]
    },
    "properties" : {
        "name" : "$pub.name",
        "area" : "$_id",
        "pub_count" : "$pub_count"
    }
}
There’s a lot going on in there. Let’s take it line by line.
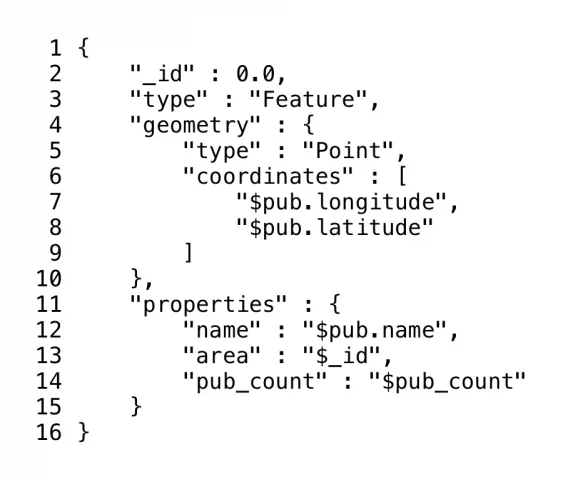
- Open the projection object with “{“
- Remove the _id field from the output by setting it to 0.
- Add a “type”:”Feature” field
- Add a “geometry” field with a JSON object as a value
- Add a “type”:”Point” field to the “geometry” object
- Add a “coordinates” field with a JSON array as a value
- Insert the pub’s longitude value into the array, followed by a comma
- Insert the pub’s latitude value into the array
- Close the coordinates JSON array with “]”
- Close the geometry JSON object with “},”
- Add a “properties” field with a JSON object as a value
- Add a “name” field with the value of the pub name to the properties
- Add an “area” field with the _id (which is the local authority name)
- Add a “pub_count” property with the calculated pub_count value
- Close the properties object “}”
- Close the projection object with “}”
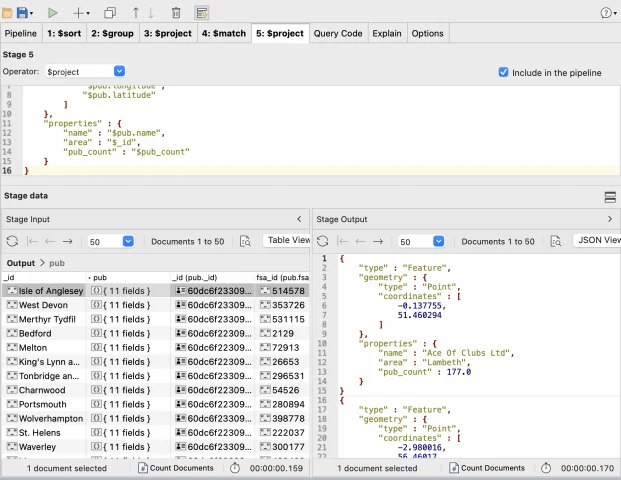
If you check the Stage Output in Studio 3T’s aggregation builder, set the view to “JSON View” and you should see well formed JSON objects with all the map data:
Now we need to get those JSON objects out of the aggregation pipeline.
Exporting the GeoJSON
We are ready to export this data to a JSON file. Click on the Export tool in the toolbar and select Current Query Result when asked for a source. Select JSON when asked for a format and move on to Configure the export itself. Set the Export Target to a file in the directory where you unpacked the HTML file for the maps earlier. Then you need to turn on the Export with commas between documents and check that JSON – mongo shell/Studio 3T is selected.
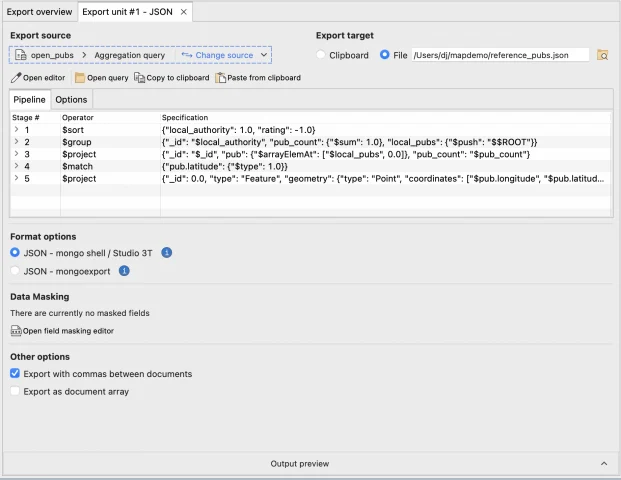
Click on Run to start the export and you should see around 367 documents exported.
Now, this isn’t a GeoJSON file yet. That’s because the contents on the file should be wrapped as a GeoJSON “FeatureCollection”. That, though, is a matter of prefixing the file from Studio 3T with:
{
"type": "FeatureCollection",
"features": [
And postfix it with a closing square and curly bracket.
No need to reach for the editor. Here’s a simple shell script to do just that:
echo '{ "type": "FeatureCollection", "features": [' >geodata.json
cat reference_pubs.json >> geodata.json
echo '] }' >>geodata.json
(It’s already in the github repository as enhance.sh to save a cut and paste). This tops and tails the exported file and writes it to geodata.json.
This name (geodata.json) is also the name of the file the web page tries to retrieve to add markers to the map. It wasn’t available earlier but now we have created it and we can try again.
If you don’t have your simple server still running from earlier, run that Python one-liner again and navigate to http://localhost:8000 and feast your eyes on a map full of markers. Click on any one of them and they’ll show you the pub name, the area and the area pub count.
Putting it in the cloud
There’s a whole panoply of ways you can put two files up on the web. Amazon’s free web tier, GitHub Pages or services like Surge. My preference for simplicity is Netlify. Sign up with them, and once your account is verified, their control panel will let you drag the folder containing the maps and geo-data file onto it with their manual deploy feature. Netlify will then use those files and automatically publish it on the web.
Studio 3T Enabled…
In this workshop, we’ve seen how Studio 3T let us use features like its flexible import and export features, powerful, modifiable, and reusable aggregation editing and update dialog to create an easily accessible interactive map.