When you are importing data into a MongoDB database, a lot of work and frayed tempers can be saved by preparing data properly before you attempt to create a MongoDB collection. In this article, I’ll be demonstrating how some real data can be imported into MongoDB and then cleaned up using aggregation and regex to better gain insights.
Extracting the data
Just so that we can use data that you can try yourself, we’ll use some rainfall records that are easily available on the internet. I chose them because they are continually updated with new data, so the need to repeatedly refresh the data in the database is more apparent. If you have no interest in rain in southeast England, just close your eyes, click your heels and pretend it is key financial data. We’re using it to demonstrate a point.
The data is for southeast England rainfall. It is in plain text.
https://www.metoffice.gov.uk/hadobs/hadukp/data/daily/HadSEEP_daily_qc.txt
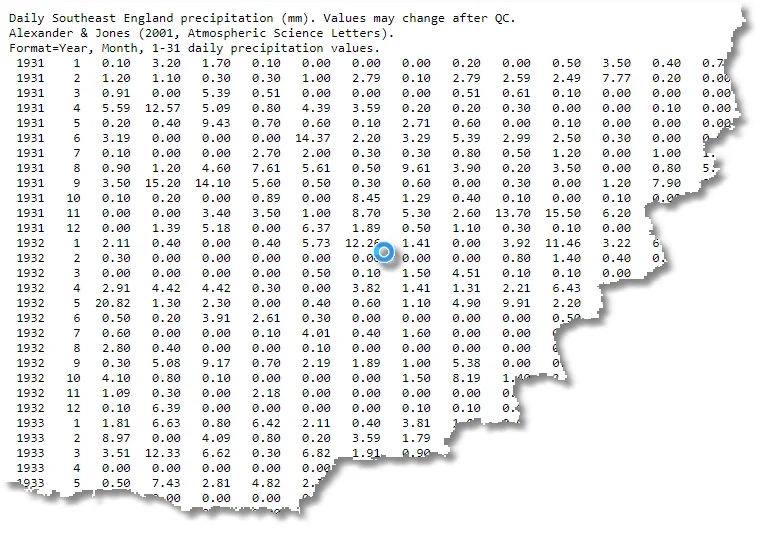
At this point, we have data in a form that might have some value in a spreadsheet but it just doesn’t work for a database. It is actually a pivoted report. The first column is the year up to the present, and the second column is the month. All subsequent columns represent the day. Because there aren’t 31 days in every month, the unused columns have -99.99 in them.
Transforming the data
If we just imported this lot, and then tried to use it in its present structure, you’d soon hit problems. How, for example, would you find the lowest and highest rainfall values within a range of dates? What sort of indexing strategy could you use?
Actually, there are a number of ways we can deal with this.
Duck the challenge
I’ve added the completed collection here in case you don’t want to try transforming the date yourself. This will allow you to play along with the next section. You will just need to unzip the data, load the collections and proceed to the ‘downstream reporting’ section.
Export data to CSV
You can read this into Excel and export it in CSV format, for example. You could then use mongoimport or Studio 3T to import the data. Not only would you then have a lot of aggregation to do in order to optimise the data for querying, but you’d get bored doing this by hand to keep the data up-to-date. You really need a way of importing this data that is more easily automated.
Convert data to JSON
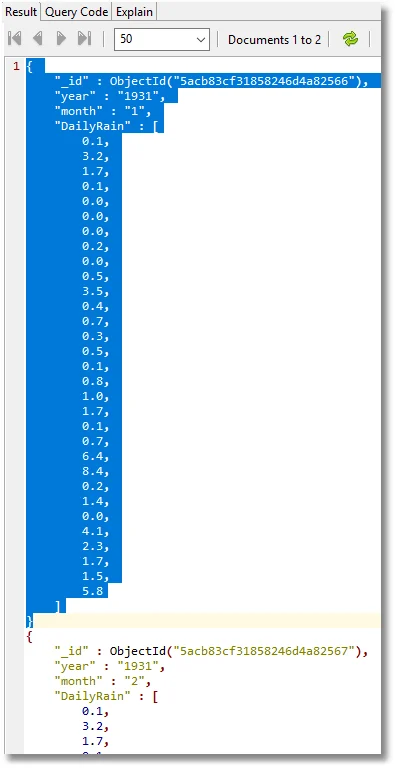
If you convert the text to JSON, using regex, there are a wider range of options. You can get it into MongoDB as a collection of documents, each representing a month with each day’s reading as an array. Here is an example of converting that month’s data into a simple list within the document.
I don’t want to do this for a few reasons. Firstly, I might want to add other datasets and compare across them. It could be that I need to do an analysis by week, quarter or day of the week, none of which really fit well into the implied data model.
Also, the clipping of the invalid data marked by -99.99 as the rainfall would be awkward to deal with. I prefer the simplest way of storing the data because it isn’t a large dataset, and I like simplicity at the document level. A dataset must be versatile, rather than optimized for a particular query. The data gods frown when you do that, and somehow induce your manager to ask for a report that you never predicted and can’t be done with your finely-crafted complex document design. Nope. Give me simplicity.
Using regex
I want to do this as automatically as possible, so I can repeat this whenever necessary. The manual process is:
- Read the data into a text editor
- Cut out the three explanatory lines at the top (can be done with regex)
- Run a regex replace on the file (I’ve used .NET dialect) to turn each line into 31 documents
- Add the ’[‘ open-square-brackets to the beginning and ‘]’ close-square-brackets to the end
- Import into MongoDB into a staging collection
- Delete every invalid record with a rainfall of -99.99mm
- Create the full MongoDB collection in an aggregation process that converts the string representation of dates into ISO binary dates and adds the location information
This ETL process is usually scripted so I can easily refresh the data from source, or I can add other sources of rainfall data later.
Here, I’ve included the regex that I used to convert the text to JSON. (I generally use Editpad Pro and RegexBuddy to develop regexes). The regex looks intimidating, but I like my regexes to be simple and ugly rather than clever. These require only mastery with copy-n-paste rather than an extra lobe to the forebrain. We give thanks for the consistent table-width of the original data source.
Find
^([d]{4})s{1,6}([d]{1,2})s{1,6}([d.-]{1,6})s{1,6}([d.-]{1,6})s{1,6}([d.-]{1,6})s{1,6}([d.-]{1,6})s{1,6}([d.-]{1,6})s{1,6}([d.-]{1,6})s{1,6}([d.-]{1,6})s{1,6}([d.-]{1,6})s{1,6}([d.-]{1,6})s{1,6}([d.-]{1,6})s{1,6}([d.-]{1,6})s{1,6}([d.-]{1,6})s{1,6}([d.-]{1,6})s{1,6}([d.-]{1,6})s{1,6}([d.-]{1,6})s{1,6}([d.-]{1,6})s{1,6}([d.-]{1,6})s{1,6}([d.-]{1,6})s{1,6}([d.-]{1,6})s{1,6}([d.-]{1,6})s{1,6}([d.-]{1,6})s{1,6}([d.-]{1,6})s{1,6}([d.-]{1,6})s{1,6}([d.-]{1,6})s{1,6}([d.-]{1,6})s{1,6}([d.-]{1,6})s{1,6}([d.-]{1,6})s{1,6}([d.-]{1,6})s{1,6}([d.-]{1,6})s{1,6}([d.-]{1,6})s{1,6}([d.-]{1,6})
Replace with
{“Date”:”${1}-${2}-1″,
 “Rainfall”: ${3}},
 {“Date”:”${1}-${2}-2″,
 “Rainfall”: ${4}},
 {“Date”:”${1}-${2}-3″,
 “Rainfall”: ${5}},
 {“Date”:”${1}-${2}-4″,
 “Rainfall”: ${6}},
 {“Date”:”${1}-${2}-5″,
 “Rainfall”: ${7}},
 {“Date”:”${1}-${2}-6″,
 “Rainfall”: ${8}},
 {“Date”:”${1}-${2}-7″,
 “Rainfall”: ${9}},
 {“Date”:”${1}-${2}-8″,
 “Rainfall”: ${10}},
 {“Date”:”${1}-${2}-9″,
 “Rainfall”: ${11}},
 {“Date”:”${1}-${2}-10″,
 “Rainfall”: ${12}},
 {“Date”:”${1}-${2}-11″,
 “Rainfall”: ${13}},
 {“Date”:”${1}-${2}-12″,
 “Rainfall”: ${14}},
 {“Date”:”${1}-${2}-13″,
 “Rainfall”: ${15}},
 {“Date”:”${1}-${2}-14″,
 “Rainfall”: ${16}},
 {“Date”:”${1}-${2}-15″,
 “Rainfall”: ${17}},
 {“Date”:”${1}-${2}-16″,
 “Rainfall”: ${18}},
 {“Date”:”${1}-${2}-17″,
 “Rainfall”: ${19}},
 {“Date”:”${1}-${2}-18″,
 “Rainfall”: ${20}},
 {“Date”:”${1}-${2}-19″,
 “Rainfall”: ${21}},
 {“Date”:”${1}-${2}-20″,
 “Rainfall”: ${22}},
 {“Date”:”${1}-${2}-21″,
 “Rainfall”: ${23}},
 {“Date”:”${1}-${2}-22″,
 “Rainfall”: ${24}},
 {“Date”:”${1}-${2}-23″,
 “Rainfall”: ${25}},
 {“Date”:”${1}-${2}-24″,
 “Rainfall”: ${26}},
 {“Date”:”${1}-${2}-25″,
 “Rainfall”: ${27}},
 {“Date”:”${1}-${2}-26″,
 “Rainfall”: ${28}},
 {“Date”:”${1}-${2}-27″,
 “Rainfall”: ${29}},
 {“Date”:”${1}-${2}-28″,
 “Rainfall”: ${30}},
 {“Date”:”${1}-${2}-29″,
 “Rainfall”: ${31}},
 {“Date”:”${1}-${2}-30″,
 “Rainfall”: ${32}},
 {“Date”:”${1}-${2}-31″,
 “Rainfall”: ${33}},
Loading the data
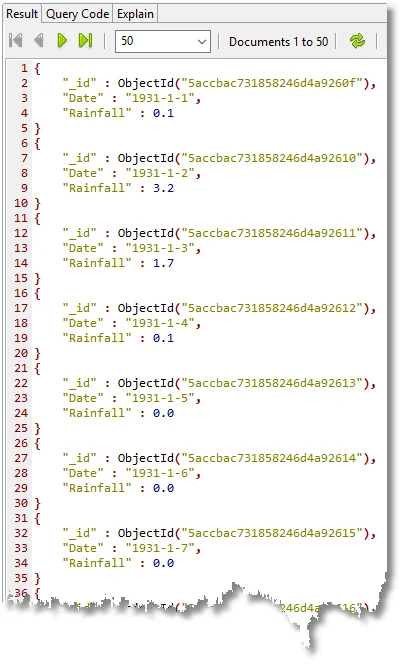
Within Studio 3T, I created a new database called ‘RainfallData’. Studio 3T makes it easy to import various file formats to MongoDB, including JSON.
The JSON was imported successfully into a ‘Staging’ collection within ‘RainfallData’. (I’d checked out a handful of documents with The JSON Validator to make doubly sure of the regex).
I then deleted all the invalid records.
use RainfallData;
 db.Staging.deleteMany(
    { //delete all invalid records with rainfall of -99.99
       "Rainfall" : -99.99
    }
 );
Y
ou need to do it this way because some of the dates from the regex will be invalid. If you try to import them using the ISODate() function on the date string, the import will fail. (Other DBMSs will shrug and convert, for example, ‘31 Feb 2018’ to ‘3 Mar 2018’. It isn’t pretty, but it keeps the show on the road.)
This sort of conversion is best done as part of data staging. This following routine converts the date to ISO binary format and adds a location code to each document. You’ll need MongoDB 3.6 for this. It used to be very unpleasant to do this before the $dateFromString function.
The staging process creates the DailyRainfall MongoDB collection if it doesn’t exist and inserts the processed data from ‘Staging’
use RainfallData;
 db.DailyRainfall.insert(db.Staging.aggregate(
 // insert into the (empty) DailyRainfall collection from Staging
    [
       {
          "$project" : {
             "Date" : {
                "$dateFromString" : {
                   "dateString" : "$Date"
                } //convert the date string to a BSON date
             },
             "_id" : 1.0, //show it
             "Rainfall" : 1.0, //show it
             "Location" : "SEE" //South East England
          } //add field so we can compare with other data Sets
       }
    ],
    {
       "allowDiskUse" : false
    }
 ).toArray());
Why the struggle to get a binary date? This is because you can’t compare dates if they are strings because 2018-4-4 will be sorted as if it were later in date than 2018-4-30; and relying on leading zeros is a cludge. Even worse, the aggregation process for getting such things as rainfall by month, or year and month becomes distinctly horrible. Whenever an ambiguous datatype is imported from another source, it pays to make the datatype one of the explicit BSON types as detailed here and here.
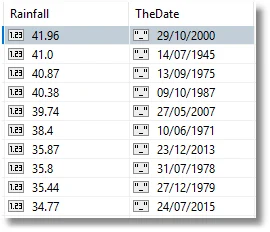
Now, we run some checks by deriving some simple reports. So when were the ten worst days of rain?
use RainfallData;
 db.DailyRainfall.aggregate(
 // produce the ten worst days of rain
    [
       { //sort the entire collection
          "$sort" : {
             "Rainfall" : NumberInt(-1) //high to low
          }
       },
       { //turn the date into a human-oriented format
          "$project" : {
             "TheDate" : {
                "$dateToString" : {
                   "format" : "%d/%m/%Y",
                   "date" : "$Date"
                }
             },
             "Rainfall" : 1.0, //show it
             "_id" : 0.0 //show it
          }
       },
       {
          "$limit" : 10.0 //just the top ten
       }
    ],
    {
       "allowDiskUse" : false
    }
 );
Hmm. Looking good. I didn’t like the way the ISO date was rendered so I changed it to a string (also very easy to do with Studio 3T, just right-click on a field and edit value type).
I used the aggregation() method – which Studio 3T simplifies through its Aggregation Editor feature – rather than find() because there seems to be no easy way of converting ISO dates into a human-readable equivalent there. ($dateToString() is an ‘Unsupported projection option’ for Find())
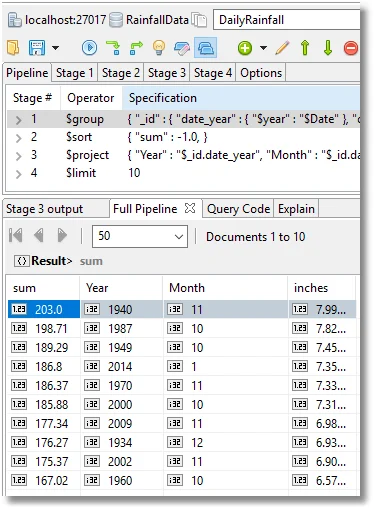
So which were the top ten wettest months? (I’ve added a calculated field to show how many inches of rain that was.)
use RainfallData;
 db.DailyRainfall.aggregate(
 // The top ten wettest months
    [
       {
          "$group" : {
             "_id" : {
                "date_year" : {
                   "$year" : "$Date"
                },
                   "date_month" : {
                      "$month" : "$Date"
                }
             },
             "count" : {
                "$sum" : 1.0
             },
             "sum" : {
                "$sum" : "$Rainfall"
             }
          }
       },
       {
          "$sort" : {
             "sum" : -1.0
          }
       },
       {
          "$project" : {
             "Year" : "$_id.date_year",
             "Month" : "$_id.date_month",
             "inches" : {//convert millimetres to inches
                "$divide" : [
                   "$sum",
                   25.4
                ]
             },
             "sum" : 1.0, //show it
             "_id" : 0.0 //hide it
          }
       },
       {
          "$limit" : 10.0
       }
    ],
    {
       "allowDiskUse" : false
    }
 );
There are a number of obvious aggregate queries that are very easy to do to reduce the data to what we want.
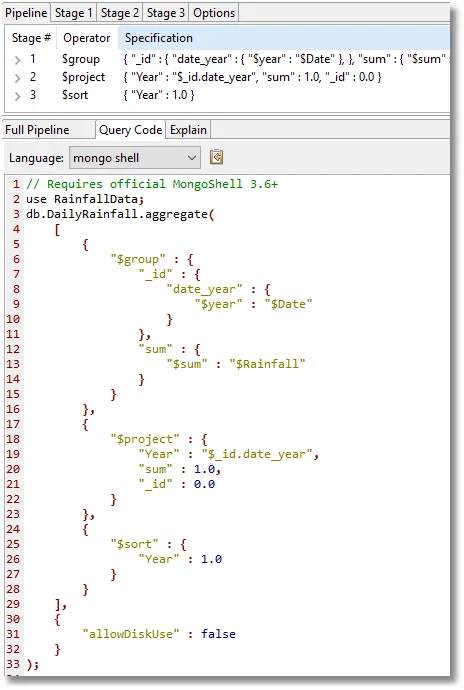
We can get the rainfall by year, for example. If we want to do it by month or day of the week (it rains more at the weekend in England), the queries are very similar.
Downstream reporting
At some point, we may want to provide output to an application that can do reporting more slickly. We could export the entire dataset but most reporting applications will want a smaller aggregate summary – a reduction of the data that makes it easy for the user. We’ll therefore prepare an aggregation that we can export to Excel.
We want, for this, a breakdown by all the common ways of displaying the data.
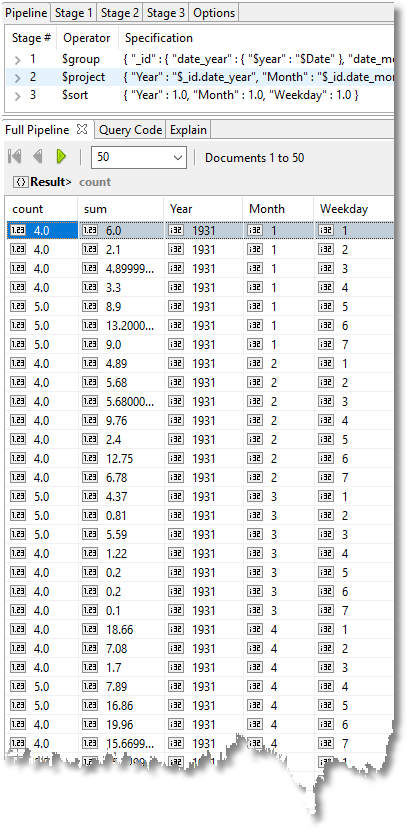
We do this via an aggregation, of course.
use RainfallData;
 db.RainfallExport.insert(db.DailyRainfall.aggregate(
 //produce an aggregate designed for downstream reporting
    [
       {
          "$group" : {
             "_id" : {
                "date_year" : { //extract the year
                   "$year" : "$Date"
                },
                "date_month" : {//extract the month
                   "$month" : "$Date"
                },
                "date_dayofweek" : {//and the day of week
                   "$dayOfWeek" : "$Date"
                }
             },
             "count" : {
                "$sum" : 1.0
             },
             "sum" : {
                "$sum" : "$Rainfall"
          //do the sum for the Year, Month, ‘Day of week’ grouping
             }
          }
       },
       { //what to show and what not to show
             "$project" : {
                "Year" : "$_id.date_year",
                "Month" : "$_id.date_month",
                "Weekday" : "$_id.date_dayofweek",
                "count" : 1.0,
                "sum" : 1.0,
                "_id" : 0.0
          }
       },
       {
             "$sort" : {
                "Year" : 1.0,
                "Month" : 1.0,
                "Weekday" : 1.0
          }
       }
    ],
    {
       "allowDiskUse" : false
    }
 ).toArray());
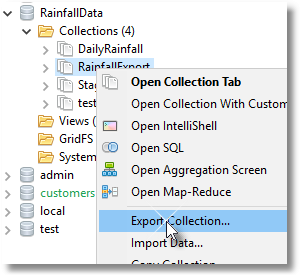
This renders down 32736 documents to 7329. We can then export the results to Excel. First we use the Export Wizard in Studio 3T:
Then save as a tab-delimited CSV file, using the wizard.
Open a new Excel Spreadsheet and you can then import the text file.
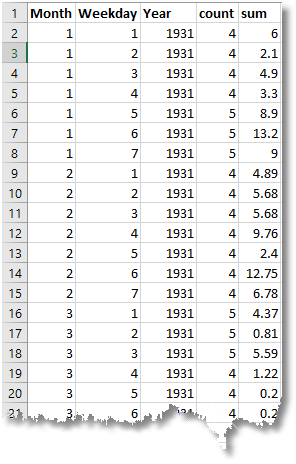
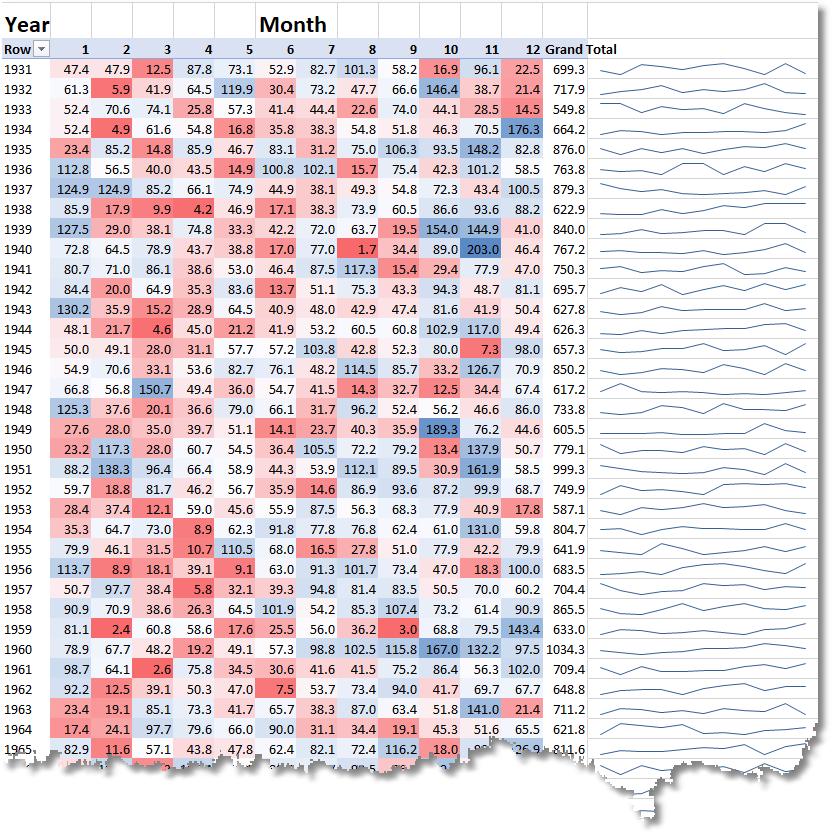
You can then create a pivot table, produce sparklines of the rainfall variations, and conditional formatting to show dry months (red) and wet months (blue)
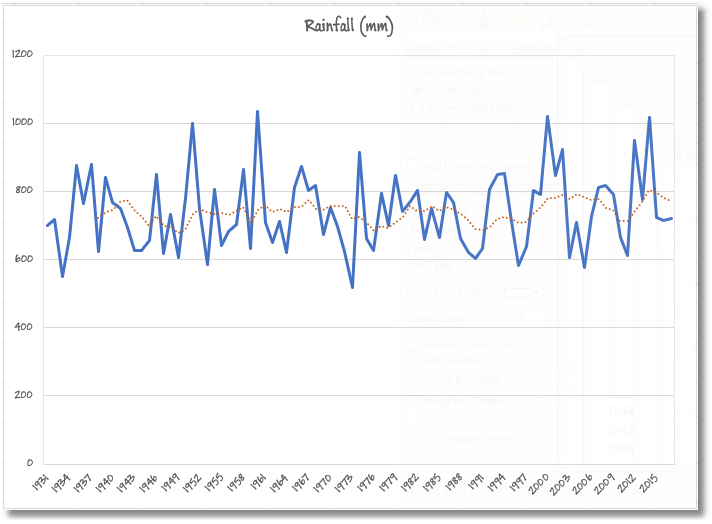
You can then use the date to plot the yearly rainfall over the past eighty seven years, and include a moving average.
Summary
Don’t be in too much of a hurry to get to the point of writing code. You’re still working when you are planning out the cleanest and most versatile way of creating a database that will then be simple to optimise and produce the summary information that you want.
Here we chose data that is extracted from an external data source in the form of a human-oriented report, and we transformed it to a form that was easy for a database or application to consume. We loaded it into MongoDB into a staging collection and did the final formatting, checking, and tidy-up there before creating the MongoDB collection which could be used for querying. We then showed how easily an aggregation can be created and exported into a reporting system.