Schema Explorer lets you visualize and analyze the collections in your MongoDB schema. You can quickly see the data distribution, find schema anomalies, and spot data outliers.
While MongoDB’s flexible schema enables developers to update applications more easily as requirements change, over time this can lead to data inconsistencies. For example, additional fields, missing fields, or variations on a particular field name.
Schema Explorer allows you to check the overall health of your data. Cleaning up data is a key step in the data migration process.
Basics
To open Schema Explorer:
- Right-click – Right-click on any connection in the Connection Tree and choose Analyze Schema
- Button – Select a collection and click on Schema in the global toolbar
To follow along with the examples shown in this article, download the Customers dataset and import it into Studio 3T.
Configure the schema analysis
Before you run the analysis, you can configure the document sample size, query criteria, and more.
Document sample size
Under Analysis source, choose how Studio 3T should read the documents: Random, First, Last, or All. By default, Studio 3T reads the documents at random.
Also choose how many documents should be read for the analysis. In this example, we will look at 1,000 documents, so set the documents field to 1000.
Analysis options
By default, Studio 3T will not analyze the elements of any array fields when it encounters them. This behavior can be overridden by clearing the Omit individual array elements box.
Query criteria
To filter the document sample size further, you can define Query Criteria. In this example, we will use an empty query which will return all documents in the collection.
Run the schema analysis
To run the schema analysis, click on the Run analysis button in the toolbar.
Analyze schema results
The analysis results page will show the following:
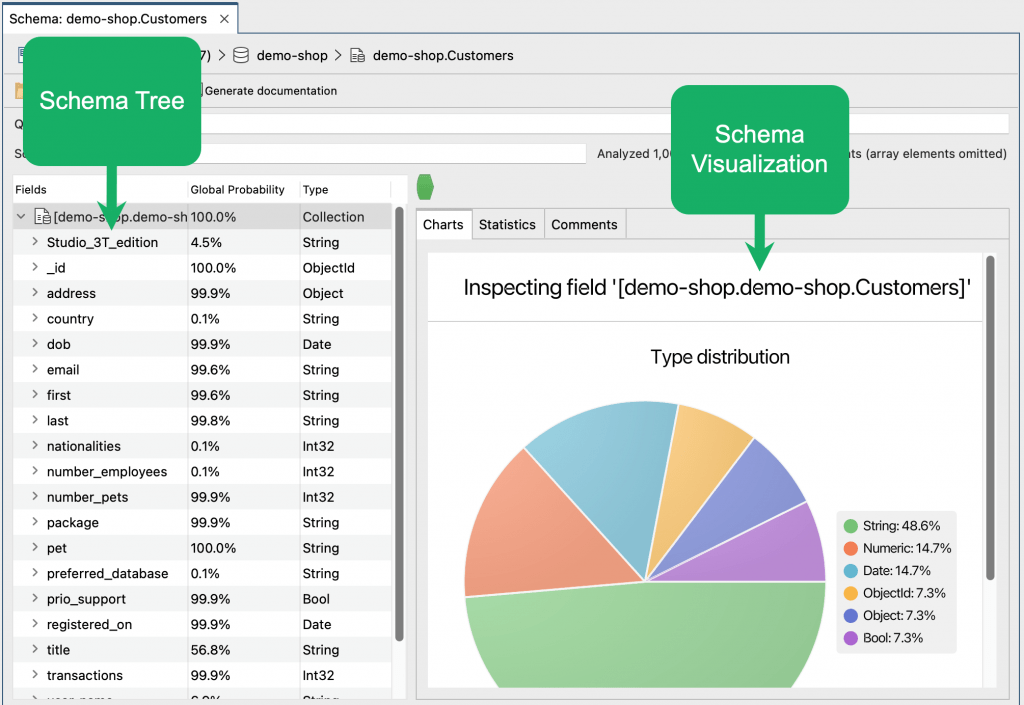
- The schema tree on the left, which shows all discovered fields, its global probability (which percentage of documents were found to contain that field), and its discovered field type(s)
- The schema visualization on the right under the Charts tab, and additional information under the Statistics and Comments tabs
Discover missing fields
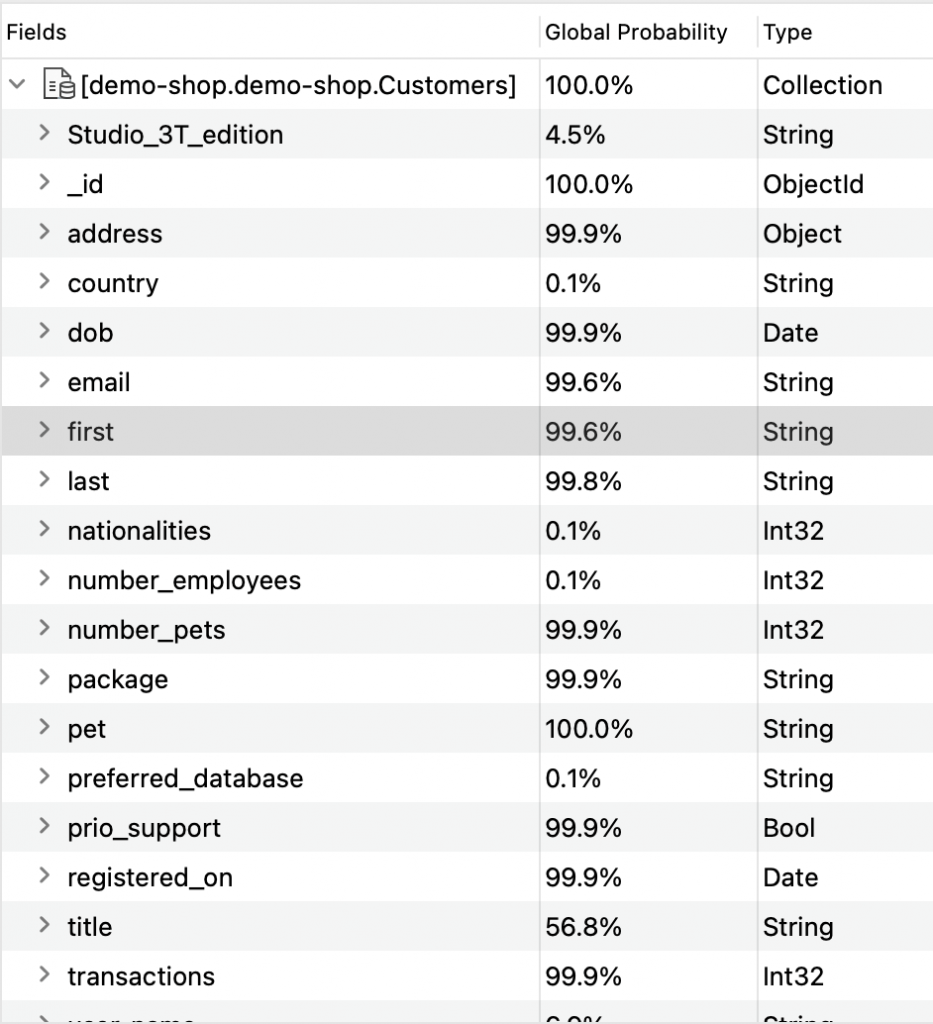
The schema tree on the left shows all discovered fields, making it easy to spot documents missing crucial fields.
In our example collection Customers, we expect certain fields to be present across all documents, like first. But as the schema analysis reveals, it is only appearing in 99.6% of the fields.
To explore documents missing a field like first, right-click on the field and choose Explore documents not containing selected field.
Discover duplicates, misspellings, and other unexpected fields
Finding missing fields is just one scenario where Schema Explorer can be valuable. Another is finding unexpected fields, such as unintentional duplicates and misspellings.

This is the case with the field user_name, which appears in around 94% of the documents, but so do two other variants: the hyphenated user-name and single word username.
Here, exploring documents containing a selected field comes in handy to easily fix the unwanted duplicates.
- Right-click on an incorrectly-spelled variant (e.g. user-name)
- Choose Explore documents containing selected field
This will open a new query tab showing all documents containing the selected field (“user-name”).
- Right-click a field value to rename it, select Field > Rename Field
- choose “All documents in collection” in the ensuing dialog to rename all occurrences in the collection, and click Rename.
Discover incorrect field types
Studio 3T also makes it easy to spot incorrect field types, like dates stored as string values.
In the Customers collection, the field address.street is stored as an embedded object, but the MongoDB schema analysis shows a few outliers where the field is stored as type String:

Clicking on the field shows the four incorrect entries:

To inspect the documents containing the incorrect field type:
Double-click on the field
Right-click on the field and choose Explore documents with selected field of type String
Exploring data distributions
The Charts tab in Schema Explorer shows various charts depending on the data type selected.
Value histograms
For numeric fields, the Value Histogram chart shows the most frequent values found within the document set.
Looking at the field transactions, it looks like most customers have had around 50 transactions.
Top values
For many field types, the Top Values chart shows the top values found for that particular type across the document set.
For example, clicking on the package field – which is of type String – will show the top values (e.g. Standard), but also indicators of a potential backend glitch (e.g. Beginner).

Date distributions
For date fields, Schema Explorer shows the detailed distributions on an hourly, daily, monthly, weekly, and all-time basis.
Looking at the field registered_on and its monthly value distribution, customer registration seems to be particularly strong in the summer as well as in January, potentially a valuable insight for marketing and sales teams.
Generate documentation
The schema analysis charts and results can easily be exported to a Word or CSV file.
After running the analysis, simply click the Generate documentation button.