Basics
In Studio 3T, there are three ways to view and navigate MongoDB data in the Result tab:
- Table View shows all the contents of your MongoDB collections or query results in rows and columns, similar to a spreadsheet.
- Tree View shows query results in a hierarchical format.
- JSON View shows collection data as JSON documents.
Use the list on the top-right side of the Result tab to change the view of your MongoDB document data:
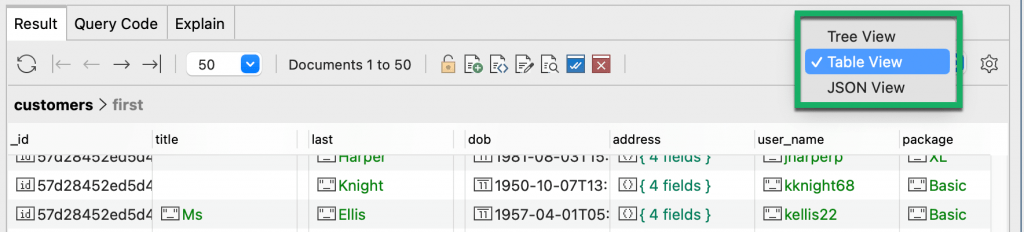
Table View is available in the Collection Tab, IntelliShell, SQL Query, and Aggregation Editor.
Edit data in-place
To edit data in-place, double-click on any cell, edit the value, and press Enter.
Sort data in ascending or descending order
To sort data, simply click on the field headers to sort data in ascending or descending order.
Change column order
To change the order in which the columns are displayed, simply click and drag the column’s field header to the required position.
Hide and show columns
The ability to hide columns is useful to reduce visual clutter, especially when showing embedded fields.
To hide (and show) columns and make viewing results easier:
- Right-click – Right-click a cell and select Column > Hide Column (or Show Column)
- Hotkey – Press Ctrl + T (⌘ + T)
Auto-size column widths
Click on the settings icon in the top-right corner of the Results tab to configure the auto-sizing options:
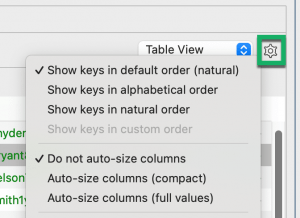
- Auto-size columns (compact) – Fits column sizes to screen
- Auto-size columns (full values) – Extends column sizes to show entirety of data in the column
You can turn off auto-sizing by choosing Do not auto-size columns.
Show and hide embedded fields
Some fields contain embedded fields. In the Customers collection, address is an example with four embedded fields: street, city, state, and zip_code.
Table View allows these embedded fields to be expanded alongside other columns for easier data analysis. The expanded field is shown with a dot before its name in the column header:
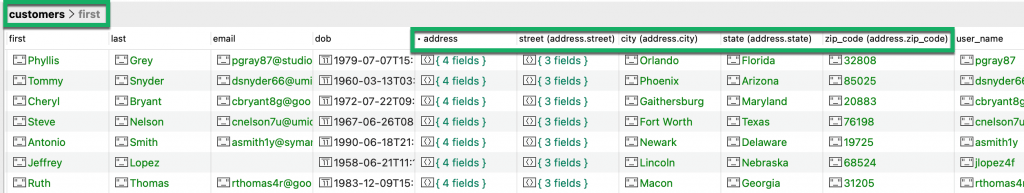
A breadcrumb trail and the complete JSON path show the field’s context within the overall data set, making navigation easier.
To show or hide a field’s embedded fields:
- Right-click – Right-click on the field with embedded field(s) and select Show Embedded Fields or Hide Embedded Fields
- Hotkey – Press Ctrl + Enter (^ + Enter)
Show or hide all embedded fields
To show (or hide) all embedded fields in a MongoDB collection, right-click on any field and select Show All Embedded Fields or Hide All Embedded Fields.
Step into arrays
With Table View, you can step into arrays and display the nested array elements on a single line. You can step into entire columns for all documents by selecting Step Into Column or you can step in at cell-level for a particular document by selecting Step Into Cell.
Copy MongoDB documents as CSV
Choose the documents you want to export, right-click, and select Copy > Copy Selected Documents as CSV or Copy Selected Documents as CSV (no headers).
Copy MongoDB documents to Excel
Right-click on the query results you want to copy to Excel and select Copy > Copy Selected Documents for Excel or Copy Selected Documents for Excel (no headers). Learn more in Copy MongoDB Query Results to CSV, Excel & Google Sheets.
Assign colors to field types
You can assign colors to field types, so that you can see query results colored according to their MongoDB data type:
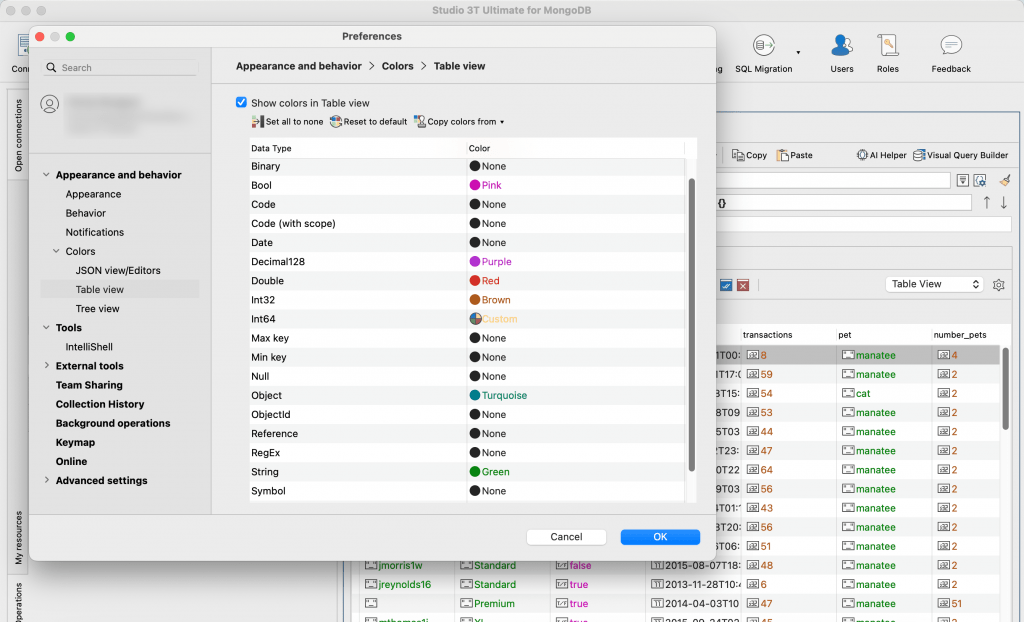
- Go to Studio 3T > Preferences.
- Go to the Appearance and behavior > Colors > Table view page.
- Configure the fields and colors as desired.
Restore the default view
To restore the default view (the view seen upon first opening a collection), right-click on any field and select Restore Default View.
This article was originally published by Kathryn Vargas and has since been updated.