With Query Profiler, instantly find slow queries using the MongoDB database profiler, visually check for missing indexes, and fix query code, so you can speed up response times in your application. Comprehensive diagnostics show you query execution times, frequency, and query code, so you can tune MongoDB performance issues fast.
Watch the video below to learn how to troubleshoot slow queries and improve query speed:
What is the MongoDB Database Profiler?
The MongoDB Database Profiler captures and logs data about operations, for example:
- operation type, such as find and aggregate queries, updates, inserts, deletes, or administration commands
- execution time
- namespace (a combination of the database name and collection name)
- query code (the query document)
The Query Profiler uses this data to identify slow queries, so that you can optimize MongoDB performance by improving query code, and adding indexes or changing the fields in existing indexes.
The MongoDB Database Profiler stores the data in the system.profile collection. You can view the system.profile data in Studio 3T, just like any other MongoDB collection, but it’s not easy to extract collection, filter, and option data for find and aggregate queries in a meaningful way. Studio 3T’s Query Profiler extracts and analyzes the profiling data so that you can understand why your queries are running slowly and shows you the query code for find and aggregation queries so that you can fix them and improve MongoDB performance.
Opening the Query Profiler
To open the Query Profiler and start monitoring MongoDB performance:
- Global Toolbar – Locate the database you want to profile in the connection tree and click the Query Profiler button
- Right-click – In the connection tree, right-click the database you want to profile, and then select Query Profiler.
- Right-click – In the connection tree, right-click a collection, and then select Query Profiler. This does not mean that you’ll be profiling data at collection level. You’ll be working with the entire database.
The Query Profiler opens in a new tab. By default, the profiler is switched off. To switch it on and start profiling MongoDB queries, click the Profiler switch.
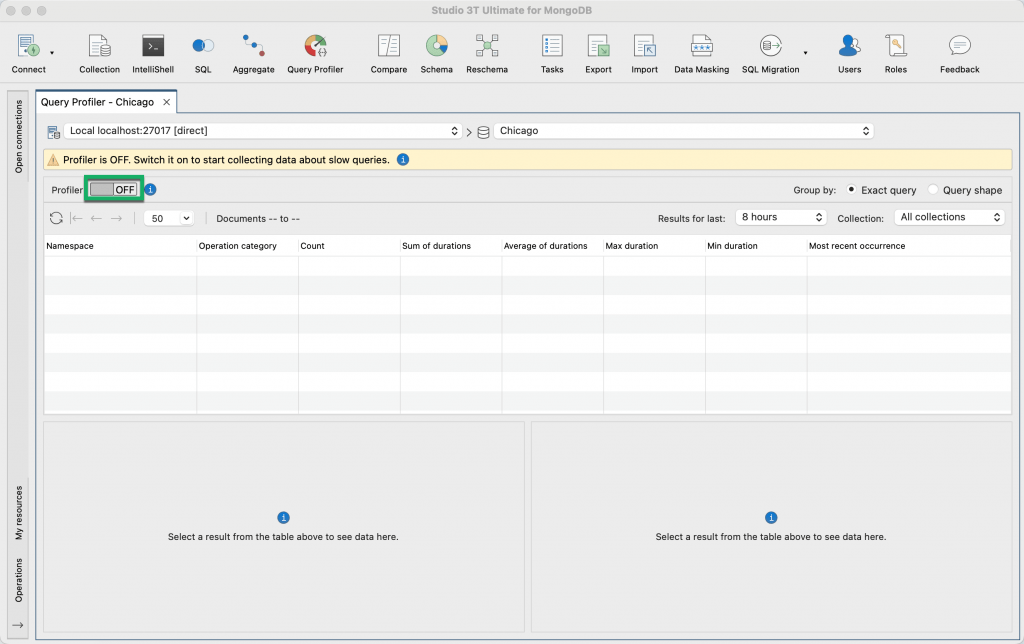
Using the Profiler switch enables the MongoDB Database Profiler and sets the profiling level to 1.
The profiling levels are as follows:
- Level 0 – The Profiler is off and is not collecting data. You can continue to work with the profiling data that has already been collected.
- Level 1 – The Profiler collects data for find and aggregation queries that take longer than 100 milliseconds.
- Level 2 – The Profiler collects data for all operations. You can’t set the profiling level to 2 in the Query Profiler but you can use IntelliShell or the MongoDB Shell to do this.
The MongoDB Database Profiler logs slow operations with:
- a slow operation threshold of 100 milliseconds
- a filter for find queries and aggregation queries
The Query Profiler does not allow you to change the profiling level, for information about how to do this in mongosh, see Configuring the MongoDB profiler.
Switching off the Query Profiler
Remember to switch off the profiler when you’re not monitoring MongoDB database performance to prevent unnecessary overhead, especially in production environments.
When the profiler is switched off, you’ll still be able to view the profiling data that has already been collected.
To switch off the profiler, click the Profiler switch.
Viewing slow queries in MongoDB
The Query Profiler shows the slow queries identified by the MongoDB Database Profiler.
By default, the items in the list are sorted by Most recent occurrence, so if you’re investigating MongoDB performance issues in real-time on a live database, the slow queries that you need to troubleshoot are shown at the top of the list.
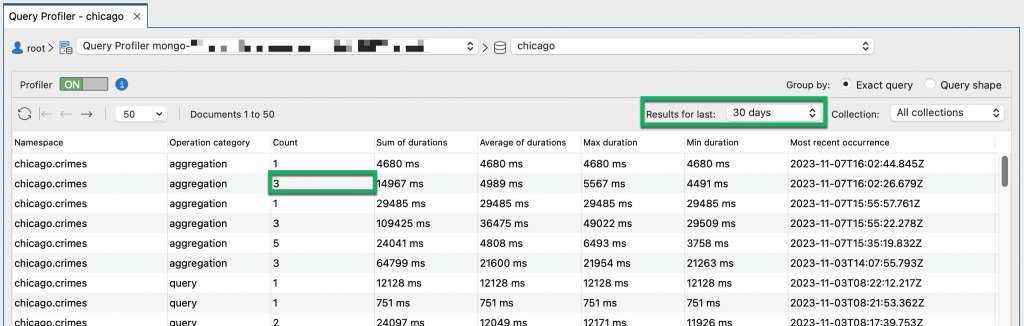
Count shows how often the query ran for the timeframe that is selected in the drop-down list. In the screenshot above, the query ran 3 times in the last 30 days.
You can group the slow queries by Exact query or Query shape. We’ll use the simple queries below to explain these groupings:
db.customers.find({"firstname": "John"})
db.customers.find({"firstname": "Mark"})
db.customers.find({"firstname": "Steve"})
Exact query shows unique queries based on field names and field values. In the simple queries above, the queries have different values, so the Query Profiler interprets them as different queries and does not group them.
Query shape shows groups of queries with the same logical structure but ignoring field values. In the simple queries above, MongoDB maintains a single query shape for each of the 3 queries, for example db.customers.find({"firstname": <String>}), and generates a hash for the query shape. MongoDB writes the hash values to the queryHash field in the system.profile collection. In the Query Profiler, you can see the hash value in the Query hash column when you group by Query shape.
When you group by Exact query, you can see if a query is a find query or an aggregation query in the Operation category column.
To filter the list:
- for a particular collection in the database, select the Collection from the list
- by when the slow queries ran, select a timeframe from the Results for last list. When Query Profiler does not show any slow queries, you may find that going further back in time and selecting a broader timeframe retrieves profiling data.
Drilling down and interpreting the profiling results
You can drill down and see the profiling data for each slow query in a group. So if a query ran 6 times, as indicated by a value of 6 in the Count field in the top panel, the bottom left section of the Query Profiler shows 6 items.

You can see how long each query took to run and when each query ran by looking at the Duration and Timestamp fields.
Keys Examined shows the number of index entries that have been scanned. If Keys Examined is zero, select the query and click the View Full JSON button to check the planSummary key value. If the planSummary value is COLLSCAN, MongoDB has performed a full collection scan and this confirms you need to create indexes on your collection to improve MongoDB performance. Or, a faster way of checking index usage is to click the Explain plan tab to see if MongoDB performed a collection scan or an index scan.
Viewing the full JSON format
The Query Profiler shows only the most useful profiling data captured by the MongoDB Database Profiler, so that you can see potential performance problems at a glance. If you need to investigate further, you can view all the profiling data that is stored in system.profile for a query, by clicking the View Full JSON button.
Query Code
The Query Code tab shows the query in MongoDB Shell language and it’s from here that you can debug and fix the slow query.
You can debug the code in Intellishell, by clicking Open in IntelliShell.
For find queries, you can debug the query in the Collection Tab, by clicking Open in Collection Tab.
For aggregation queries, you can debug the query in the Aggregation Editor, by clicking Open in Aggregation Editor. The Aggregation Editor makes it easier to troubleshoot the slow query by showing you the input data and output data for each stage in turn.
Explain plan
Explain plan is a visual representation of the performance of a MongoDB find query. It shows the query plan and the steps MongoDB took to run a query, with runtime statistics for each step.

Explain plan is useful for checking if a query is using an index. If it is not using one because MongoDB has performed a collection scan, and you want to create an index, locate the collection in the connection tree, right-click, and select Add Index. To find out more, see Adding an index.
If the query is already using an index, check that the query is filtering as much data as possible first of all. For a detailed explanation, see Optimize queries by applying relevant filters.
FAQs about MongoDB performance tuning with Query Profiler
The impact depends on how heavy the database load is. If the server load is already heavy, using the Profiler switch to enable the MongoDB Database Profiler increases the demand on the server.
When the profiler is switched on it also uses disk space because it has to store the profiling data it has collected.
The MongoDB Database Profiler stores data in the system.profile collection.
In Studio 3T, you can view and query the system.profile collection in a Collection Tab just like any other collection. Simply locate the profiled database in the connection tree, open the System folder, and double-click the system.profile collection.
The Profiler switch in the Query Profiler sets the profiling level to 1 when you switch it on to enable the MongoDB Database Profiler.
The Profiler switch in the Query Profiler sets the profiling level to 0 when you switch it off to disable the MongoDB Database Profiler. No further data is collected but you can still view existing profiling data.
If you want to collect profiling data for all operations, you can set the profiling level to 2 in IntelliShell or in the mongo shell, using the db.setProfilingLevel() method. See the MongoDB documentation, for a full description.
Note that if you modify the db.setProfilingLevel() method and apply a filter so that data is not collected for find queries or aggregation queries, then the Query Profiler cannot display slow queries for those operations.
You can change the profiling threshold in IntelliShell or in the mongo shell, using the slowms setting on the db.setProfilingLevel() method. By default, the slow operation threshold is 100 milliseconds. See the MongoDB documentation, for a full description of the slowms setting.
The Query Profiler won’t display profiling data if your MongoDB user doesn’t have find privileges on the system.profile collection.
You may find that going back further in time and selecting a broader timeframe retrieves profiling data. To do this, use the Results for last drop-down list.
To view profiling information from system.profile for find and aggregation queries, select the database in the Studio 3T connection tree and open the Query Profiler.
In the Query profiler, the most recent slow queries are displayed at the top of the list. You can:
- filter the operations by collection, by selecting the required collection in the Collection drop-down list.
- filter the operations by a particular time range, by selecting a timeframe in the
Results for last drop-down list, for example slow queries in the last 30 minutes, 7 days, or 30 days.- sort the results by how long each query took to run, by clicking the duration headers,
Sum of durations, Average of durations, Max duration, or Min duration.
A good place to start optimizing MongoDB queries is indexing strategy. Take a look at the Knowledge Base article How to Optimize MongoDB Queries Using find() & Indexes, where we explain the basics and provide simple examples.
If you know you don’t need to return all the documents in a collection, it’s a good idea to limit the number of results using the limit () method in your queries. And, you should only return the fields that you need using projections.
In the Query Profiler, go to the Explain plan tab. If the query has used an index, you will see an Index scan stage, otherwise you will see a Collection scan stage.
Locate the collection in the connection tree, right-click, and select Add Index. If you’re unsure of the collection name, you’ll find it in the Namespace field in the Query Profiler.
Create the index using the Add index dialog, see Adding an index for more information. The Add index dialog is part of the Index Manager.
If the slow running query is already using an index and you want to change the indexed fields, first locate the collection in the connection tree. If you’re unsure of the collection name, you’ll find it in the Namespace field in the Query Profiler. Then under Indexes, double-click the index you want to modify.
Change the fields using the Edit index dialog, see Editing an index for more information. The Edit index dialog is part of the Index Manager. When you change the indexed fields using the Index Manager, Studio 3T drops the index for you and recreates the index. Recreating indexes has an impact on database performance.
In Studio 3T’s Query Profiler, the Explain plan tab provides statistics about the performance of each stage in the query plan and when the query ran. The Explain plan tab also shows you if a query is using an index and how it is using it.
By default, the Query Profiler displays the most recent slow query at the top of the list. You can sort the queries by when they ran by clicking the header on the Most recent occurrence field.
Depending on the timeframe you have selected, when you fix a query you may find it disappears from the Query Profiler. This is expected behavior. When the query runs, its performance has improved beyond the profiling threshold. In other words, it takes less than 100 milliseconds to run.
For replica sets, the profiler works individually for each set member. By default, the primary is selected when you open the Query Profiler. To profile secondaries, select each set member in turn using the connection drop-down list and use the Profiler switch to enable the MongoDB Database Profiler for that set member.
Learn more about optimizing MongoDB queries
Watch Roman Right demonstrate practical tips to make queries faster, diagnose slow queries, and how to write a focused aggregation query. Find the series of videos on our blog.
Learn more in our Knowledge Base:
- How to speed up MongoDB queries with Studio 3T’s performance tools for tips on improving MongoDB query performance
- MongoDB Indexes | A Complete Guide and Tutorial to boost MongoDB performance by creating indexes with Studio 3T’s Index Manager
- Visual Explain | MongoDB Explain, Visualized to help you understand the execution plan and analyze query performance