In this workshop, we’re going to take a dataset and turn it into an interactive map that you can host pretty much anywhere. On the way, we’ll show how you can use MongoDB aggregations to filter the data, how Studio 3T helps compose those aggregations and export the results, ready to view. By the time we are finished, we’ll see Great Britain like this:
Getting our data
What are we going to map? Well, everyone loves a pub and these days pubs need all the love they can get. If only there was a dataset which could tell us where all the good pubs were in all the various locales of Great Britain. Turns out there is; open-pubs. This is curated by the fine people at GetTheData who take public data sets and make them available with postcode information.
We’ll create a database for this exercise, ‘pubs’ and then download the open-pubs data.
Now, the open-pubs data is in CSV format, so let’s head to Studio 3T’s Import tool and select CSV import. The raw data lacks field names, but that is not a problem. Select Target Options on the import and you can assign field names and field types. The names come from the open-pubs page and the types are all strings, apart from easting and northing (integers) and latitude and longitude (decimal).
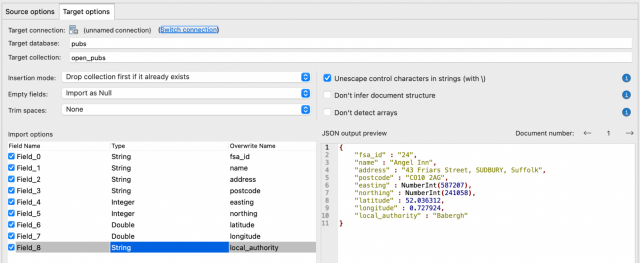
We’re importing it into a collection called ‘open_pubs’. Running that import should get you around 51,167 records.
Learn more about importing data into MongoDB with Studio 3T
Rating our data
Our data set would, ideally, have a rating with each pub, but unfortunately it doesn’t. There’s a couple of options to fix this. First, create some random dummy ratings, second, gather ratings from around the web. Thirdly, visit all 51,167 pubs and rate them. For convenience and speed, we are going to use the first option. The third option is left as an exercise for the reader.
Open the ‘open_pubs’ in a collection view and click the update dialog button. We’re going to want to apply this change to all the documents, so select All Documents and then go to the update tab, select Update with Aggregation Pipeline and copy this short pipeline in:
[
  {
    $set: {
      rating: { $floor:
                 { $multiply: [ { $rand: {} }, 10 ] }
              }
      }
  }
]
So it looks like this:
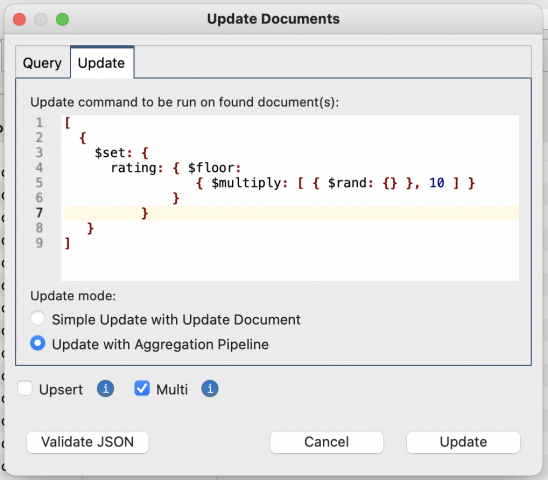
Click on Update and all documents will now get a random rating from 0.0 to 9.0.
Aggregating the pubs
We aren’t going to display 51,167 pubs. That would be a very very crowded map. What we want to do is find the highest rated pub in an area and map that. And for the area, we’ll use the local_authority field. For this, we need aggregation. Go to the Aggregation tool and start building a pipeline. We’ll step through the stages now:
Learn more about creating a MongoDB aggregation in Studio 3T
1: $sort the pubs by local authority and rating
In a $sort stage, sort by local_authority, then by descending pub rating:
{
    "local_authority" : 1.0,
    "rating" : -1.0
}

This makes our data ready to be grouped by local authority and the pubs will already be sorted. So our next step is…
2: $group up the results by local authority
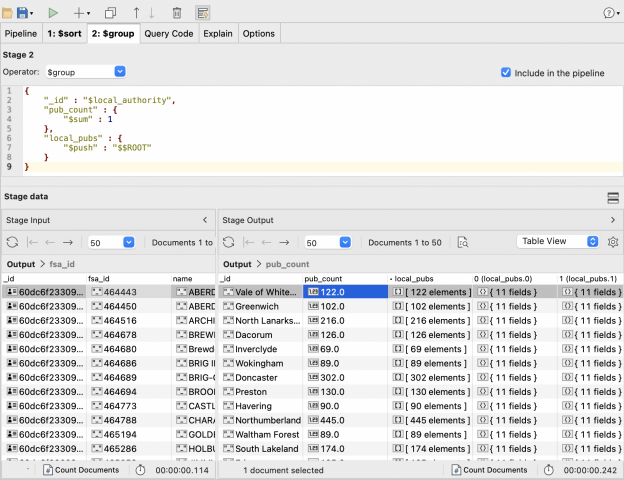
Next, we $group the results up by local authority and put all the pubs, in sorted order, into an array for each authority. While we do that, use $sum to count the number of pubs into pub_count:
{
    "_id" : "$local_authority",
    "pub_count" : {
        "$sum" : 1
    },
    "local_pubs" : {
        "$push" : "$$ROOT"
    }
}
What’s that “$$ROOT” you may ask? It’s an aggregation variable, which refers to the entire document currently passing through the pipeline. So this “$push” takes the incoming pub document and pushes it, in its entirety, into the local_pubs array. If you look at the Stage Output below, you can see the local_pubs array is full of pub documents:
3: $project only the top pub in the area
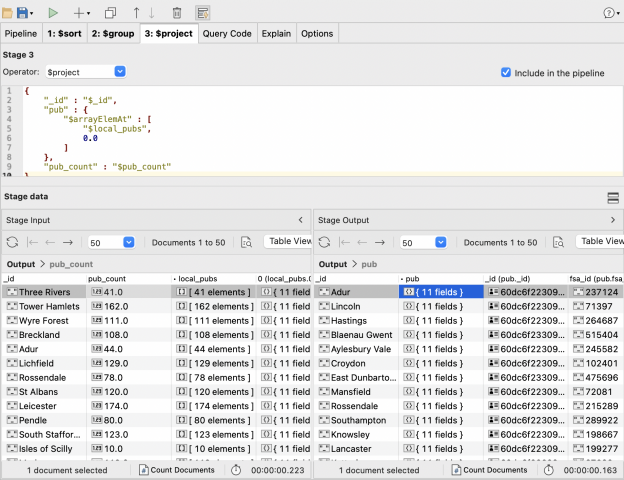
Now. for every local authority (now in the id field), we will just $project the 0th element on the pub array (using “$arrayElemAt”) and the count of pubs:
{
    "_id" : "$_id",
    "pub" : {
        "$arrayElemAt" : [
            "$local_pubs",
            0.0
        ]
    },
    "pub_count" : "$pub_count"
}
This will leave us with a collection which has, for each local authority, the authority’s name as an id, a field called pub which has the details of the top rated pub in that authority and a count of pubs in pub_count.
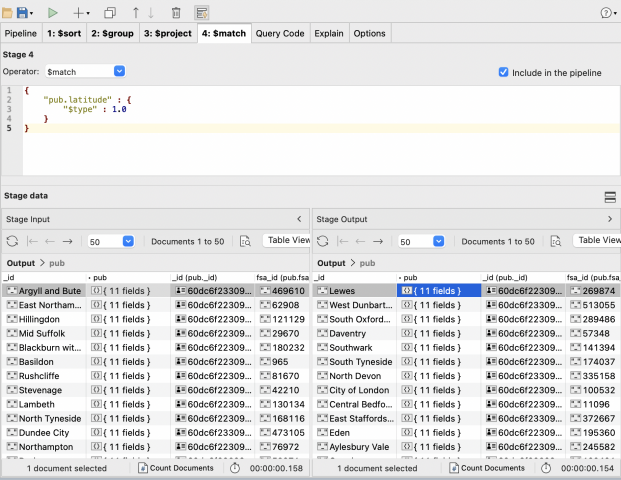
4: $match only “good” locations
When we were building this example, I found that there were some bad coordinates in the geographical data. So, here we are only going to $match with documents where the pub’s latitude is a number:
{
    "pub.latitude" : {
        "$type" : 1.0
    }
}
“$type” matches when the type of the value in the document matches the type of the value specified. 1.0 is a number, so it only matches numbers.
A Pause
And we’ll pause here for a moment. We have a set of pubs, one per local authority, with geographical data to locate them and an address. In the second part of this workshop, we’ll take this carefully aggregated data and create some MongoDB GeoJSON and make that into an interactive map you can host anywhere. Head there now.
