Q: People tell me I should only have the indexes I need on my MongoDB collections. How do I find out which indexes are actually in use for a collection?
A: It’s good advice that you make sure collections only have the indexes you need. It can be tempting to add an index that matches every query that you make on a collection but that has a cost. Indexes are ideally always in memory, but when memory the system may move them to disk. If they get taken out of memory you end up losing a lot of their performance boosting ability.
The Problem With Indexes
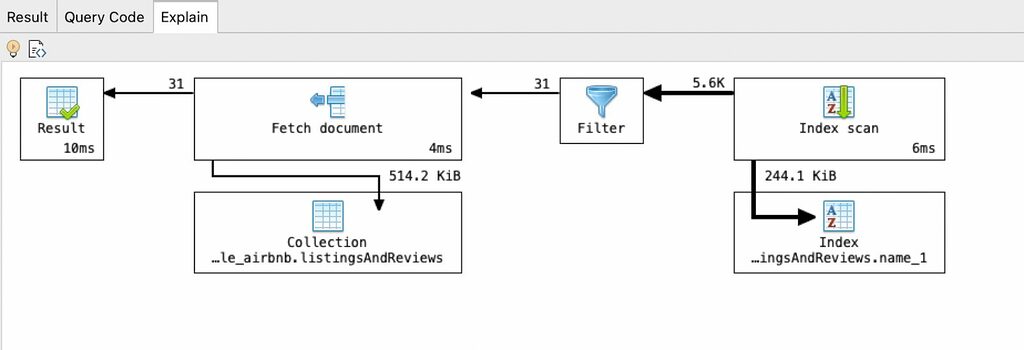
Also, the more indexes you have, the more work MongoDB has to do when you insert a document, updating each and every index. Indexes work their magic in the background though. It is hard to tell if they are in use though. You need to look at the “explain” output from MongoDB and interpret that. Or you can use Studio 3T’s Visual Explain which interprets it for you. It will show you when a collection’s index is in use for a particular query.

Here we see that the scanning of the name field uses the name index. It gives us the fifty six thousand (56K) results which then pass through a filter. That leaves us matching thirty one (31) documents which MongoDB directly retrieves from the collection (via the _id index) and we get the results. It’s a lot easier to understand than a JSON document (which is what the explain command produces).
Introducing MongoDB’s $indexStats
Visual Explain tells you how an index is helps. But it doesn’t tell you how often that index comes into play. For that, we have to go look at MongoDB aggregation. Which sounds a little odd, but in aggregation is a pipeline stage $indexStats and if you look it up in the MongoDB documentation, you’ll find it’s been around since MongoDB 3.2 and it returns lots of information about a collection’s indexes.
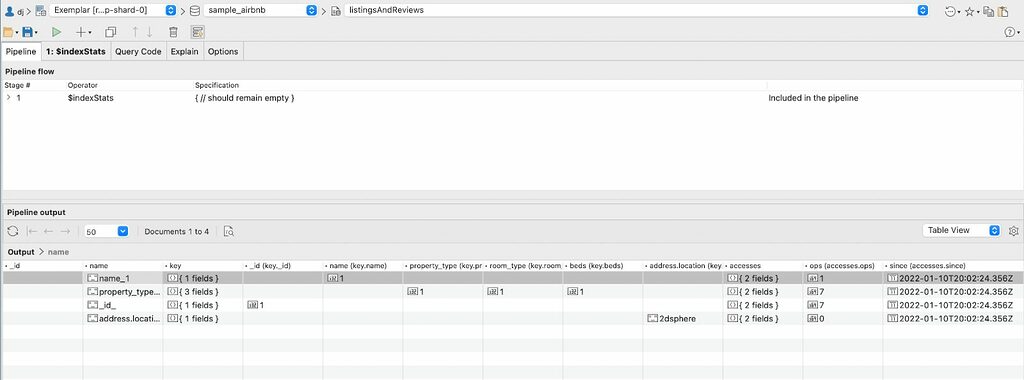
Here’s the pipeline in the Studio 3T Aggregation Editor. The $indexStats stage has to be the first stage in the pipeline and it takes no document parameters.

The results for each index of the collection forms a document in the results. Each one has the name of the index and a key object. The key object lists each field used in the object and the type of index. Notice the address.location_2dsphere index has a 2dsphere index specifically for geo searches. For now, let’s close up the key field and zoom in on these results:

The next object in the $indexStats results is an accesses object. This contains two values, the number of times this a query has accessed the index and the time when that counting started. That clock will be reset when there is a server restart or when modifications are made to the index. Finally, there’s a host value recording the server where this value was originates from. If you were working with a sharded cluster, you would see information about which shard this data was came from.
Reading The Results
But circling around, what really interests us is how many accesses the index has had. We can see the _id_ index has 7 access ops against it, the same as the composite property_type_1_room_type_2_beds_1 index which can cover a number of queries. The name_1 index only has one op against it. And finally the address.location_2dsphere index has no operations at all. Obviously this is just an example and your ops numbers in production should be higher, but this illustrates what we are looking for, an index that’s not being accessed.
And here it appears that no one is doing any geo searches against this collection, despite there being a 2dsphere index. Wait, wait, before you go and delete it, do make sure it is never being put to use. Queries using that index only exist in an occasionally run task, That’s a case for finding out if the cost and value of having the index makes sense. Also, before you drop the index, you’ll need to consider if the index is useful in stopping that query placing too high a load on the server.
The decision on whether to drop an index is rarely a simple “has it been used recently” question, but the $indexStats results will help inform you which indexes could be candidates for removal.
Bonus: $indexStats with the shell
If you don’t have Studio 3T’s Aggregation Editor to hand, you can still run $indexStats by hand. The command would be something like:
db.getCollection("listingsAndReviews").aggregate([ { "$indexStats": { } } ] );
Where you’d replace “listingsAndReviews” with the name of your collection. You’ll get results in JSON format similar to this:
{
   "name": "_id_",
   "key": {
       "_id": 1
   },
   "accesses": {
       "ops": NumberLong(7),
       "since": ISODate("2022-01-10T20:02:24.356Z")
   },
   "host": "exemplar:27017"
}
{
   "name": "property_type_1_room_type_1_beds_1",
   "key": {
       "property_type": 1,
       "room_type": 1,
       "beds": 1
   },
   "accesses": {
       "ops": NumberLong(7),
       "since": ISODate("2022-01-10T20:02:24.356Z")
   },
   "host": "exemplar:27017"
}
...
The fields are the same as discussed above.
Finally
MongoDB Indexes are a great way to speed queries, but only when used with an eye on the trade-off between memory and performance. With $indexStats, you’ll have a bit more insight into how useful your indexes are.


