Skip to content
Studio 3T - The professional GUI, IDE and client for MongoDB
  • Tools
    • Aggregation Editor
    • IntelliShell
    • Visual Query Builder
    • Export Wizard
    • Import Wizard
    • Query Code
    • SQL Query
    • Connect
    • Schema Explorer
    • Compare
    • SQL ⇔ MongoDB Migration
    • Data Masking
    • Task Scheduler
    • Reschema
    • More Tools and Features
  • Solutions
  • Resources
    • Knowledge Base
    • MongoDB Tutorials & Courses
    • Tool/Feature Documentation
    • Reports
    • Case Studies
    • Whitepapers
    • Blog
    • Testimonials
    • Community
  • Contact us
    • Contact
    • Sales Support
    • Feedback and Support
    • Career
    • About Us
  • Store
    • Buy Now
    • Preferred Resellers
    • Team Pricing
  • My License
  • Download
search

Where’s my full Studio 3T Aggregation Explanation? #Studio3T_AMA

Posted on: 02/09/2021 (last updated: 22/02/2022) by DJ Walker-Morgan

Q: I want to use Studio 3T’s Visual Explain on an aggregation but I don’t see any timings after the initial query. What’s wrong?

Welcome to the latest Studio 3T Ask Manatees Anything – #Studio3T_AMA. Want to know how to use Studio 3T to make your MongoDB life better? Just tweet your question using the #Studio3T_AMA hashtag or email your query to [email protected].

A: What we’re talking about here is the output of the Explain tab in the Aggregation Editor. If you’ve never opened the Explain tab on a find query or an aggregation, you are missing out. When shown, the Explain tab takes the output of MongoDB’s explain() function and translates it into a usable, visual chart. And you have the option to run that query and harvest the run time stats for that query, stage by stage.

Earlier this year, we extended the reach of Visual Explain to include the Aggregation tool. For most users it works fine, but for some, there is an issue. It’ll show them the query plan and aggregation stages quite happily. However, when they click the “Run Full Explain” light bulb icon what they can see looks something like this:

An aggregation explain view without most of the statistics.
Just an execution plan, but where’s the statistics?

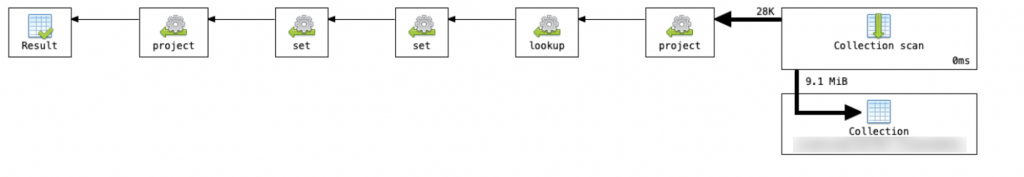
The most likely reason you’ll see this is because you are running MongoDB pre version 4.4. Before MongoDB 4.4, the explain() operation when applied to an aggregation returned only the statistics related to the initial query itself. The rest of the output from explain was muted about how long it took to run or how much it processed, leading to this rather anemic output.

The fix is to upgrade your database to MongoDB 4.4 or later. If you are on Atlas, it should be auto-upgrading and already be on 4.4. If you are running MongoDB locally, on-premises or self-hosted, you’ll have to work through the manual upgrade steps to get yourself up to date.

When you’ve done that and come back to the aggregation, go to Explain, click Run Full Explain and the result now looks like this:

The aggregation explain view, now with all the statisics
All the timing and record counts are now visible

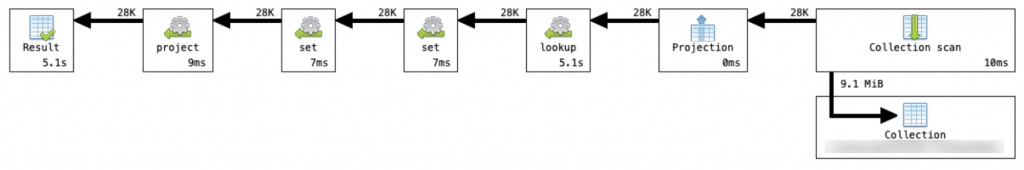
Now we can see how many documents passed through the pipeline and how long each stage took. Check out that 5 second lookup stage, if we double click on it we’ll be able to see the details of that stage and its timings. And we can check that we’re working with indexed fields in that foreign collection (spoiler: yes we are). The incoming and outgoing arrows on that stage show 28,000 documents passing through; a lot of separate lookups which explains the time taken.

Visual Explain for Aggregations gives you a quick way to figure out which stage is taking time so  you can optimize your aggregation or choose a different strategy.

Related reading: MongoDB Explain, Visualized


How helpful was this article?
This article was hideous
This article was bad
This article was ok
This article was good
This article was great
Thank you for your feedback!

About The Author

DJ Walker-Morgan

Dj has been around since Commodore had Pets and Apples grew everywhere. With a background in Unix and development, he's been around the technology business writing code or writing content ever since.

Related articles

  • MongoDB Aggregation Made Easy with 3T’s Aggregation Editor
  • What’s in the Studio 3T Operations Pane? #Studio3T_AMA
  • More Dataset And Schema Clean Ups With Studio 3T – #Studio3T_AMA
  • How do I use MongoDB regex (regular expressions) in Studio 3T? #Studio3T_AMA
  • How do you make Studio 3T export MongoDB collections to unique files? #Studio3T_AMA

Tags

academy aggregation AMA atlas community connections date tags events export features hackolade import intellishell JSON knowledge base migration modelling mongodb mongoodb productivity query regex releases schema security SQL Studio 3T tasks tips updates webinar windows

Browse by MongoDB topic

  • Connecting to MongoDB
  • Database Administration & Security
  • Getting Started with MongoDB
  • Getting Started with Studio 3T
  • Import/Export
  • Job Automation & Scheduling
  • MongoDB Aggregation Framework
  • MongoDB/Studio 3T Workshops
  • Performance
  • Query & CRUD Operations
  • Reference
  • Schema
  • Studio 3T Licensing
  • Support and other resources
  • Working with MongoDB & SQL
  • Working with MongoDB Atlas

Studio 3T

MongoDB Enterprise Certified Technology PartnerSince 2014, 3T has been helping thousands of MongoDB developers and administrators with their everyday jobs by providing the finest MongoDB tools on the market. We guarantee the best compatibility with current and legacy releases of MongoDB, continue to deliver new features with every new software release, and provide high quality support.

Find us on FacebookFind us on TwitterFind us on YouTubeFind us on LinkedIn

Education

  • Free MongoDB Tutorials
  • Connect to MongoDB
  • Connect to MongoDB Atlas
  • Import Data to MongoDB
  • Export MongoDB Data
  • Build Aggregation Queries
  • Query MongoDB with SQL
  • Migrate from SQL to MongoDB

Resources

  • Feedback and Support
  • Sales Support
  • Knowledge Base
  • FAQ
  • Reports
  • Case Studies
  • White Papers
  • Testimonials
  • Discounts

Company

  • About Us
  • Blog
  • Careers
  • Legal
  • Press
  • Privacy Policy
  • EULA

© 2022 3T Software Labs GmbH. All rights reserved.

  • Privacy Policy
  • Cookie settings
  • Impressum
When you click "Accept", you are agreeing to cookies being on your device. They may improve site navigation, site usage analysis, or the relevance of messages. It is up to you which cookies are enabled. Read our Privacy Policy.
Manage cookies
Accept
✕

Privacy Preference Center

A cookie is a small file of letters and numbers that is downloaded on to your computer when you visit a website. Cookies are used by many websites and can do a number of things, eg remembering your preferences, recording what you have put in your shopping basket, and counting the number of people looking at a website. In the form below you can choose which cookies, except for essential cookies, to allow or disable.

Accept all cookies

Manage consent preferences

Essential cookies are strictly necessary to provide an online service such as our website or a service on our website which you have requested. The website or service will not work without them.

Performance cookies allow us to collect information such as number of visits and sources of traffic. This information is used in aggregate form to help us understand how our websites are being used, allowing us to improve both our website’s performance and your experience.

Functional cookies collect information about your preferences and choices and make using the website a lot easier and more relevant. Without these cookies, some of the site functionality may not work as intended.

Social media cookies are cookies used to share user behaviour information with a third-party social media platform. They may consequently effect how social media sites present you with information in the future.

Accept selected