If you aren’t happy with the performance of a MongoDB database, there are a number of things to look at, such as:
- Indexing strategies
- Database schema design issues
- Abnormal traffic load, network problems
- Inadequate available physical memory resources
- Locking problems
- Inappropriate access strategies
- Hardware limitations
- Number of open database connections.
An obvious place to start is to check for long-running MongoDB queries, and queries that are executed frequently but aren’t optimised.
Indexes are the low-hanging fruit for the database developer: an adjustment to your indexing strategy can work wonders.
Indexes are useful for finding a small subset of data from a collection.
They can also speed up some aggregate() operations if they operate on only a part of the collection defined by the initial match() stage, or use some types of sorting operations.
But it is in the
find()andfindone()methods that indexing becomes essential.
In this article, we will be looking at indexes and the MongoDB find method from an entirely practical viewpoint, using a practice database in a sandbox.
Given a whole set of frequently-executed queries, how do you find out the slow ones, and how do you see which are working well? How do you see which indexes are being used? We’ll be demonstrating this but encouraging you, the reader, to try things out.
Collation in MongoDB
Before we go further with the find() method and indexes, I must give a few cautionary words about collation.
Collations are important to databases.
MongoDB defaults to a binary sort which humanity doesn’t understand or appreciate. After all, words don’t often change in meaning if written in capitals.
Occasionally, accented characters are deemed to be equivalent to unaccented ones. Humanity can’t agree on the order in which you sort strings, or even what characters are valid, because written languages and nationalities vary so much. Because of this, we invented collations. For English speakers, there is a sensible collation.
Indexes and views have to share the same collation as the collections.
You ought to specify a default collation for a view at creation time and it should be the same as the collection until you are confident with the complication of using different collations.
Views don’t inherit the collection’s default collation, but default to a binary collation. Fortunately, MongoDB does indexes differently: it creates indexes with the collection’s default collation if you don’t specify a collation.
We need to first check the collation of the collection we’re working with because no string searching with find() or aggregate() can use an index that has a different collation.
The collation must be the same. Neither will you be able to join collections or views using with $lookup or $graphLookup via string-based fields if they have different collations.
So what is our current collation? We can check this with the command
db.getCollectionInfos({name: 'Customers'})
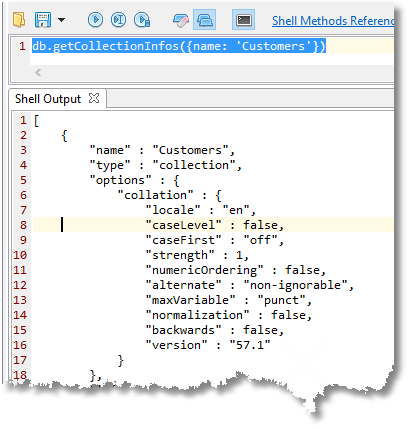
If you are stuck with the wrong collation, you can specify a matching collation with both find() and aggregate().
Quite often, collections are given the ‘simple’ binary collation that causes strange things to happen even in western nations when, for example, you are searching through names that have inconsistent capitalisation.
I’ve chosen the language to be ‘en’ (International English: see Supported Languages and Locales) and strength 1, meaning ignore case, together with accents and such things (both diacritic- and case-insensitive, see Collation in the MongoDB manual).
Because MongoDB creates the index with the collection’s default collation, which is the sensible choice, you can use the simple syntax rather than specify the collation.
Monitoring your MongoDB query (unobtrusively)
We are going to roll up our metaphorical sleeves and check out our queries to see how they perform.
For the time being, we are only going to be interested on the overall strategy they use and the time they take. We can get a lot craftier than this, but at the cost of slightly scarier code. We’ll start with looking at individual queries and then examine a whole bunch of them.
Imagine that we want to find a customer by name.
db.Customers.find({
   'Name.First Name': 'Nigel',
   'Name.Last Name': 'Levine'
   },{
   'Full Name': 1
})
//returns the documents where the customer's first name is 'Nigel' and his last name is 'Levine'
Lets see how this performs.
Firstly we will start profiling. If you want to know more about the profiler, then I’ve written an article to explain all that.
db.setProfilingLevel(2)
We make sure there is no index lingering about and then we execute the find().
db.Customers.find({
  'Name.First Name': 'Nigel',
  'Name.Last Name': 'Levine',
  $comment: "Without any index"
}, {
  'Full Name': 1
})
Aha! What is that comment for? It is to remember what we did when we subsequently look at how the query performed.
We are also going to use that comment to flag up that we want to monitor the query, so that when we monitor the queries, we can leave out all the other queries and just view the queries that are commented in our reporting.
To peek at all our subsequent queries in the order they were executed, we can execute this find() in the system.profile where the performance information is stored by the profiler.
Yes, we are using the find() method to investigate the performance of the find() method.
db.system.profile.find({
  "ns": 'customers.Customers',
  'command.find': 'Customers',
  'command.comment': {
    $exists: true
  }
}, {
  'command.filter': 1,
  'command.comment': 1,
  'command.projection': 1,
  'millis': 1,
  'planSummary': 1
}).sort({
  $natural: -1
}).limit(5).pretty()
What this means is, find the last five queries that we’ve just executed in the namespace of our collection, that is executing a find() and has a comment.
Return the filter, projection, and comment together with the number of milliseconds it took and the summary of the chosen plan.
And here is what it finds:
{
	"command" : {
		"filter" : {
			"Name.First Name" : "Nigel",
			"Name.Last Name" : "Levine",
			"$comment" : "Without any index"
		},
		"projection" : {
			"Full Name" : 1
		},
		"comment" : "Without any index"
	},
	"millis" : 60,
	"planSummary" : "COLLSCAN"
}
60 milliseconds? This is a long time. It had to do a COLLSCAN, which is a scan right through the collection.
In a big collection that won’t fit in memory that could mean trouble. It needs an index.
We start with a simple index that uses just the Last Name:
db.Customers.createIndex(
   { 'Name.Last Name': 1 },
   { name: 'justTheLastName' }
)
We then execute the query, changing only the comment within the query. Then we re-execute our profiling query, and we see this:
{
	"command" : {
		"filter" : {
			"Name.First Name" : "Nigel",
			"Name.Last Name" : "Levine",
			"$comment" : "Just The Last Name"
		},
		"projection" : {
			"Full Name" : 1
		},
		"comment" : "Just The Last Name"
	},
	"millis" : 3,
	"planSummary" : "IXSCAN { Name.Last Name: 1 }"
}
OK. You’ve won. 60 milliseconds down to 3 milliseconds is probably all you need. With that index, MongoDB was able to just get the documents with the ‘Last Name’ of ‘Levine’ before checking for ‘Nigel’.
Also you now have a general way of seeing how your queries perform, just as long as you remember to switch off profiling after you’ve finished your performance checks.
I realise that we have ‘bigger fish to fry’, but we could maybe improve on that 3 ms execution time. What if we added the ‘First Name’ to the index?
db.Customers.createIndex(
   { 'Name.Last Name': 1,'Name.First Name': 1 },
   { name: 'LastNameAndFirstName' }
Well, this happens:
{
	"command" : {
		"filter" : {
			"Name.First Name" : "Nigel",
			"Name.Last Name" : "Levine",
			"$comment" : "Last Name and First Name Index"
		},
		"projection" : {
			"Full Name" : 1
		},
		"comment" : "Last Name and First Name Index"
	},
	"millis" : 3,
	"planSummary" : "IXSCAN { Name.Last Name: 1, Name.First Name: 1 }"
}
Yes, MongoDB chose the new index in preference, but it didn’t help enormously because there was only one person with that name.
When I went on to try an index that included the projected field as well, this new index was chosen and it was so fast as to be immeasurable (0 milliseconds). It worked too for queries that only filtered on the ‘Last Name’, which is the most obvious one.
Now we will try a MongoDB query that based on the ‘First Name’ and we’ll make it a bit more complicated by asking for people called either ‘Nigel’ or ‘Ken’.
db.Customers.find({
   $or: [{'Name.First Name': 'Ken'}, {'Name.First Name': 'Nigel'}],
   $comment: "Without any special index"
})
And as we expect, it couldn’t use any of our indexes.
{
	"command" : {
		"filter" : {

			"$or" : [
				{
					"Name.First Name" : "Ken"
				},
				{
					"Name.First Name" : "Nigel"
				}
			],
			"$comment" : "Without any special index"
		},
		"comment" : "Without any special index"
	},
	"millis" : 86,
	"planSummary" : "COLLSCAN"
}
So let’s give it the obvious index.
db.Customers.createIndex(
   { 'Name.First Name': 1 },
   { name: 'FindByFirstName' }
)
And after executing it we find it reduced to three milliseconds.
{
	"command" : {
		"filter" : {
			"$or" : [
				{
					"Name.First Name" : "Ken"
				},
				{
					"Name.First Name" : "Nigel"
				}
			],
			"$comment" : "With the FindByFirstName index"
		},
		"comment" : "With the FindByFirstName index"
	},
	"millis" : 3,
	"planSummary" : "IXSCAN { Name.First Name: 1 }"
}
We can see that the our index was used by checking the planSummary field.
So what if you use a regex query?
{
	"command" : {
		"filter" : {
			"Name.First Name" : /^Nigel/i,
			"$comment" : "With no index"
		},
		"projection" : {
			"Full Name" : 1
		},
		"comment" : "With no index"
	},
	"millis" : 59,
	"planSummary" : "COLLSCAN"
}
{
	"command" : {
		"filter" : {
			"Name.First Name" : /^Nigel/i,
			"$comment" : "With FindByFirstName index"
		},
		"projection" : {
			"Full Name" : 1
		},
		"comment" : "With FindByFirstName index"
	},
	"millis" : 231,
	"planSummary" : "IXSCAN { Name.First Name: 1 }"
}
This isn’t what you’d expect.
If there is a suitable index, the query optimizer cheerfully selects the index and uses it. It takes four times as long over it, despite the fact that the regex specifies a start at the beginning of the string. If ever there was a good illustration of the need to profile frequently-used queries, this is it.
The next stage would be to take an in-depth look at what is going on with the query, looking at the execution statistics.
db.Customers.find({
  'Name.First Name': /^Nigel/i
}, {
  'Full Name': 1
}).explain('executionStats')

//return the execution stats for the query that provides the full names of anyone called Nigel
This will have to wait for a subsequent article!
Finding problem queries
Now we have a good way of tracking our queries, let’s take a whole stack of them, and execute them all in a batch. I should really comment them all since they are a good habit to get into, but I’d like to illustrate other ways of finding them in the system.profile. We first create our indexes that we reckon will do the trick, and then execute the queries.
I use Studio 3T’s IntelliShell to do this.
Here are our sample queries:
db.Customers.find({'Addresses.County': 'Norfolk'})

//returns the documents that have an address in the county of Norfolk
db.Customers.find({'Addresses.County': 'Norfolk'}).count()

//returns the number of documents where the county is Norfolk
db.Customers.find({'Addresses.County': 'Norfolk'},{ '_id':0, 'Full Name' : 1})

// find the full name of all people with an address in the county of Norfolk
db.Customers.find({'Addresses.County': 'Norfolk'}).sort({'Name.Last Name':1}).limit(10)

// find the first ten people with addresses in Norfolk ordered by their last name
db.Customers.find({'Addresses.County': 'Norfolk'}).sort({'Name.Last Name':1}).skip(10).limit(10)

// find the documents of the eleventh to twentieth people with addresses in Norfolk
// ordered by their last name
db.Customers.find({'Addresses.County': 'Norfolk'},{ '_id':0, 'Full Name' : 1,'Addresses.
db.Customers.find({'Addresses.County':'Somerset', 'Addresses.type': 'Home'},{ '_id':0, 'Full Name' : 1,
'Addresses.
db.Customers.find({"Addresses.Dates.Moved In" : {"$gt" : "2016-1-1"}});

//returns the documents where there is an address where rgw customer moved in later than 2016
//as well as $gt, you can also use $lt (<), $gte (>=), $lte (<=), and $ne (!=)
db.Customers.find({'Addresses.County': {$in: ['Essex', 'Suffolk', 'Norfolk','Cambridgeshire']}})

//customers where address is in East Anglia
db.Customers.find({'Cards': {$elemMatch: {
            "CardNumber" : "5443779644968920",
            "ValidFrom" : "2015-02-04",
            "ValidTo" : "2024-11-14",
            "CVC" : "031"
        }}})

//returns the documents where 'Cards' is an array that matches a full description of a card number
db.Customers.find({'Cards': {$elemMatch: {"CardNumber" : /544/ }}})

//returns the documents where 'Cards' is an array that contains a CardNumber matching "544"
db.Customers.find({$or: [{'Name.First Name': 'Ken'}, {'Name.First Name': 'Nigel'}],
$comment: "With the FindByFirstName index"})

//returns the documents where the customer's first name is either Ken or Nigel
db.Customers.find({'Name.First Name': 'Nigel', 'Name.Last Name': 'Levine',$comment: "Without any index"},
{'Full Name':1})

//returns the documents where the customer's first name is 'Nigel' and his last name is 'Levine'
db.Customers.find({
  'Name.First Name': 'Nigel',
  'Name.Last Name': 'Levine',
  $comment: "Last Name, First Name and Full Name Index"
}, {
  'Full Name': 1
})

//returns the documents where the customer's first name is 'Nigel' and his last name is 'Levine'
db.Customers.find({'EmailAddresses.EmailAddress' : /Zohi.com$/i},{'_id':0, 'Addresses':0,'Name':0,
'Notes':0, 'Phones':0})

//find all customers with an email address that uses Zohi.com
//don't return the id, Addresses, Name, Notes or Phones
db.Customers.find({'Cards.CVC': /^26/},{'Full Name':1 , 'Cards.
db.Customers.find({'Full Name': /^Mr Nigel/i},{'Full Name':1})

//return the full names of anyone called Nigel with the title ‘Mr’
db.Customers.find({'Full Name': {$regex: /^Mr N[\w]*g[\w]*l/, $options: 'si' }},{'Full Name':1})

//one can also use the regex operator
db.Customers.find({ $text: { $search: 'customer' } },
    {
        "Full Name" : NumberInt(1),
        "Notes" : NumberInt(1)
    })

//notes that contain the word 'customer' on a text search. Requires a text index */
/* Queries which cannot be indexed */
db.Customers.find({Addresses: {$size:2}})

//find customers with two addresses
db.Customers.find({Cards: {$size:4}})

//find customers with four credit cards
db.Customers.find({'Addresses.County': {$nin: ['Essex', 'Suffolk', 'Norfolk','Cambridgeshire']}})

//customers who don't live in East Anglia (Essex, Suffolk, Norfolk or Cambridgeshire)
db.Customers.find({'Notes.Text' : {$exists: false}})

//full name containing a string
db.Customers.find({'Full Name': /Gallegos/})

//regex without the ^
db.Customers.find({'Name.First Name': /N[\w]*g[\w]*l/i},{'Full Name':1})

//return the full names of anyone whose first name has in sequence  an ‘n’, a ‘g’ and ‘l’ in it
Before we execute these queries, we’ll need a text index for the query that searches the notes:
db.Customers.createIndex( { 'Notes.Text': 'text' },{
    "v" : 3,
    "name" : "Notes.Text",
    "ns" : "customers.Customers",
    "default_language" : "english",
    "textIndexVersion" : 3,
    "collation" : {
        "locale" : "simple"

    }
} )
There will be several others that will help too, such as these:
db.Customers.createIndex(
   { 'Name.Last Name': 1,'Name.First Name': 1,'Full Name':1 },
   { name: 'LastNameAndFirstNameAndFullName' }
)
db.Customers.createIndex(
   { 'EmailAddresses.EmailAddress': 1 },
   { name: 'EmailAddress' }
)
I’ll leave you to work out the others!
Now that we have executed them all, we want to see how long they all took and whether they were able to use indexes.
We just make a small change in our query that extracts the information we need from the system.profile.
We know that there were twenty-five queries, and this is a development server with only one connection so I don’t need to use the comment attribute to do the search. I can just choose the last twenty-five queries executed on our collection. I can see what query is being executed, how long it took and whether it had to scan the whole collection or whether it was able to use the index.
Here, I’m just realizing I haven’t done a suitable index for the email addresses:
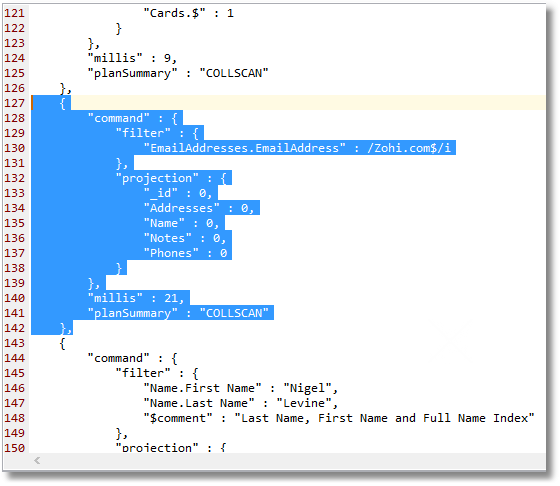
Sadly, that one will struggle to make best use of an index because the regex is obliged to scan the entire string of every document in the collection.
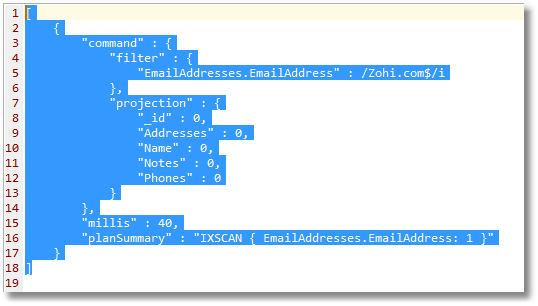
However, if you then create an index and retest, it tries to read the data from the index rather than the entire collection, and is actually slower, taking almost twice the time.
Using MongoDB’s system profile
The system.profile soon fills with a lot of queries and aggregations when you are developing code. We’ve already shown how easy it is to just select find() methods for our collection with comments in it. (I’ve just given the filter without any projection.)
db.system.profile.find({"ns" : 'customers.Customers','command.find' : 'Customers','command.comment':{$exists:true}})
You can just get the ten most recent by sorting by the time it was executed and limiting it to ten, to get the last ten queries.
db.system.profile.find({"ns" : 'customers.Customers','command.find' : 'Customers'}).sort({'ts':-1}).limit(10)
I’ve left out the projection clause because we aren’t changing that. Here is a query that selects the top twenty slowest find() queries in the past half hour (or whatever time limit you want to put in it: it is 30 minutes converted to milliseconds.
db.system.profile.find({
  "ns": 'customers.Customers',
  'command.find': 'Customers',
  'ts': {
    $gt: new Date(ISODate().getTime() - 1000 * 60 * 30)
  }
}, {
  'command.filter': 1,
  'command.projection': 1,
  'millis': 1,
  'planSummary': 1
}).sort({
  'millis': -1
}).limit(20)
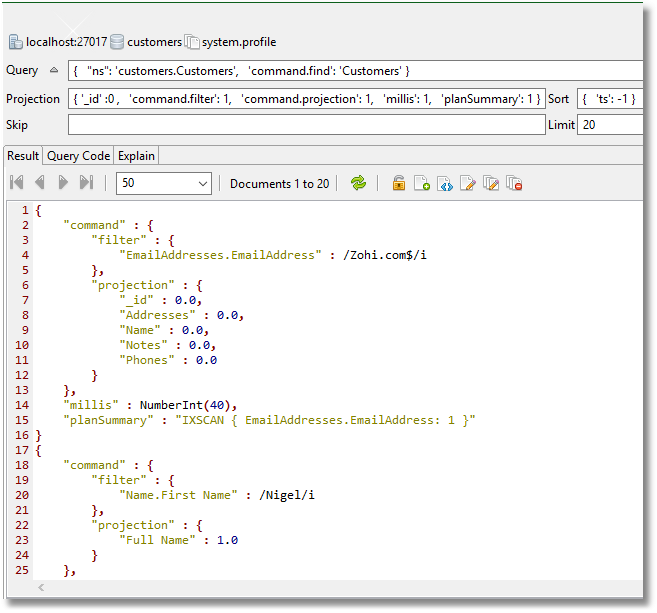
You can use Studio 3T to view the system profile. To get to it, just open up the System collection for the customers database and right-click on the system profile to get the context menu.
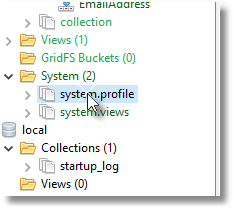
Then choose ‘Open Collection Tab’. If you just select the system.profile, you can click on ‘Collection’ in the ribbon bar.
Here is a session where I’m looking at the last twenty queries executed on the Customers collection.
Summary
When you are doing performance work on a MongoDB database, it is worth checking for the obvious first.
To do this, it is worth checking that the simpler find() queries are supported by an index and are avoiding scans of the entire collection.
When you have more than a handful of these regular queries, it is worth using the MongoDB profiler to check easily on your progress. You can quickly see if there are improvements or otherwise in the execution of these queries with changes in your indexing strategy.
In this article, I’ve tried to provide a sandbox to provide a quick way of experimenting with queries and profiling them to get the best performance from them. I hope this helps.


