Q: I want to get the MongoDB statistics for all my MongoDB collections in Studio 3T. How?
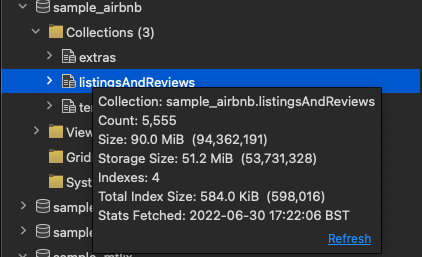
A: This question came from 3T Community user Hannes Schurig, who wondered if there was a way to report on the MongoDB collection statistics that appear when hovering over a collections name in the Studio 3T Connection Tree. Well, right now, there isn’t a built in tool for that, but Studio 3T makes it easy to create and run a Mongo script to do that. So let’s do that, and show you some pro-tips for scripting.
Without further ado, here is the script.
var dbs = db.getMongo().getDBNames();

for (adb of dbs) {
    var colls = db.getSiblingDB(adb).getCollectionNames()

    for (coll of colls) {
        var info = db.getSiblingDB(adb).getCollection(coll).stats(1024);
        if (info.ok) {
            printjson({
                ns: info.ns,
                count: info.count,
                size: info.size,
                storageSize: info.storageSize,
                nindexes: info.nindexes,
                totalIndexSize: info.totalIndexSize
            });
        }
    }
}
Running the MongoDB Statistics Script
Connect to a MongoDB database in Studio 3T. Then, open IntelliShell for any server, database or collection in that server.Next, paste in that script and click the Run button.

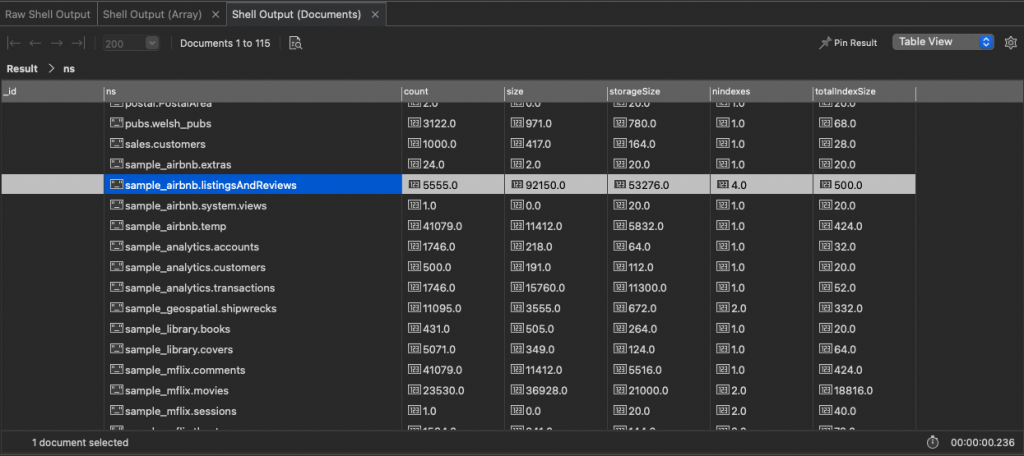
The columns mostly match up with the fields you see when you hover over a collection and the tool-tip pops up.

If you’d run this script in the raw shell, your results would have appeared as just JSON. Thanks to Studio 3T, they are formatted as a table (or JSON). And you can sort the columns to quickly find the collection with the most records (count), or largest storage or biggest indexes.
By default, the results are limited to 50 collections. Go to the Preferences/General and adjust Initial Page Size when Showing Documents to increase the number of collections initially shown.
BTS: Behind the Script
Very simply. The script first gets all the names of the databases in the server using getDBNames() as an array. Then it uses a for loop to step through each database name in the array.
For each named database, it gets all the collection names using getCollectionNames() as an array. And then it uses a for loop to step through each collection name in the array.
For each collection, it then runs the stats() method which returns a typically very large document full of information about the collection. The number passed to the stats method is the scaling value for storage sizes. By default, values are returned in bytes. Pass 1024 (1K) to stats and the values are scaled in Kilobytes.
It may, though, actually return a document with an explanation of whether there was an error getting the stats. This happens more than you would suspect, because getCollectionNames() returns collection AND view names and view names don’t have any statistics because they are calculated on demand from an aggregation pipeline.
How can we tell if there’s an error? Well, there’s an “ok” field in the returned document. If that’s set to true, we print out our statistics. We only want some of the statistics, so we use the printjson command and pass it a javascript object with named fields and values from the statistics document.
Why don’t we just print the values? Well, this is where IntelliShell comes in. If it sees JSON data being output in the shell, it turns it into a table (or JSON) display, using the field names as column names. This makes it easy to view and compare and sort the returned data without adding more script.
Finally
Don’t forget to use Studio 3T’s bookmarks to save this script ready for when you next need to get your MongoDB statistics. As you can see, while scripting with MongoDB is powerful, using Studio 3T makes it so much easier to read and use the results from your scripts.


