Don’t know where to start with tuning the performance of your MongoDB database? Are your queries and aggregations taking too long to return results?
Get started right away on optimizing your MongoDB queries using Studio 3T’s performance tools. Use:
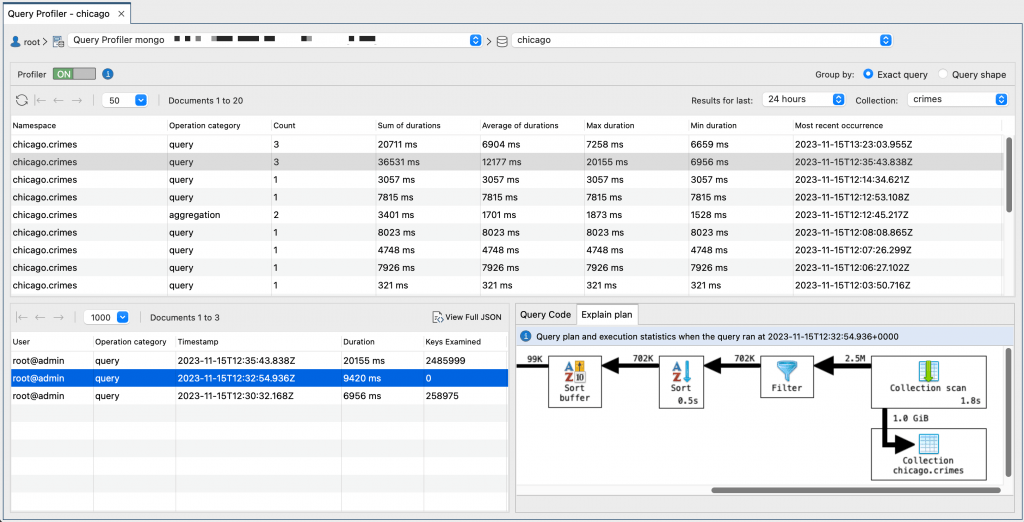
- Query Profiler to see all your slow running queries at a glance
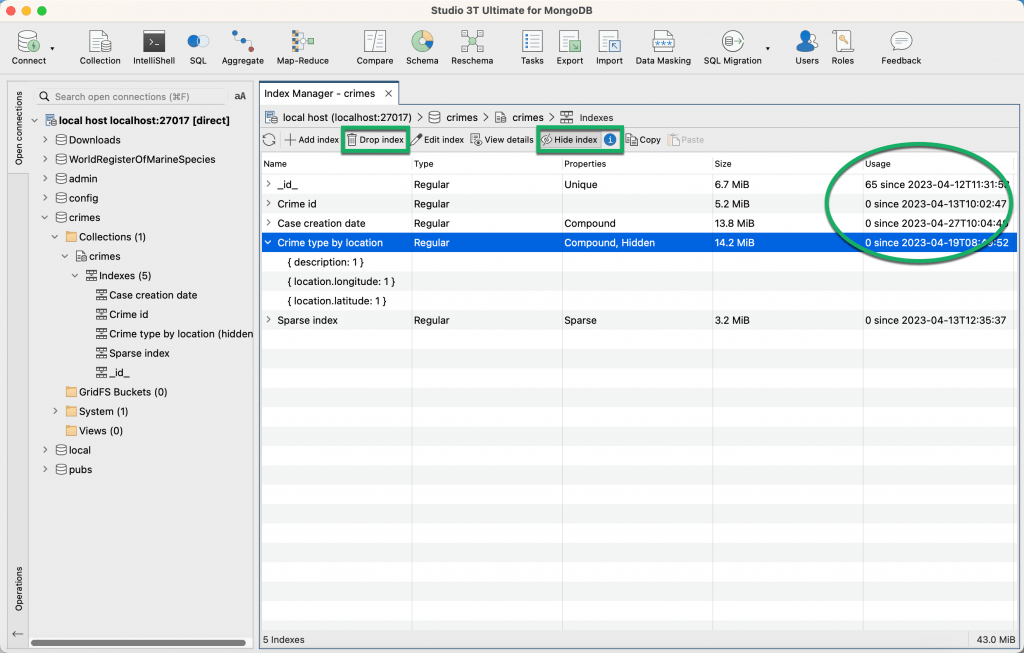
- Index Manager to easily add indexes or change indexed fields
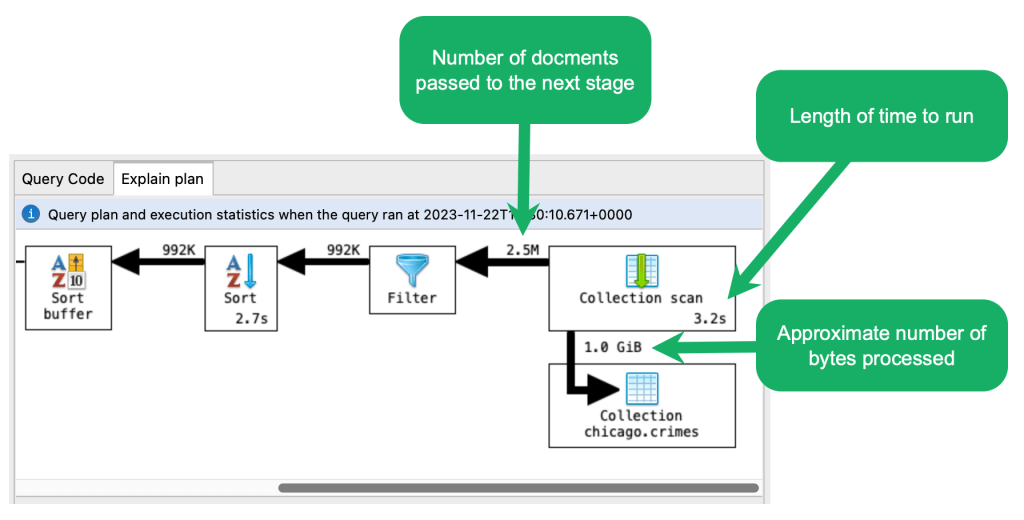
- Visual Explain for a visual representation of the steps MongoDB took to run a query, with runtime statistics for each step
Finding problem queries and fixing them is the first step to debugging MongoDB performance issues. Studio 3T’s performance tools make this even easier than ever.
In this article, we’ll share some simple tips on how you can improve MongoDB database performance, give you a brief overview of the Studio 3T performance tools that will help you achieve this, and provide a walkthrough of how you can use the tools.
Tips for improving the performance of your MongoDB database
- Identify slow queries using Studio 3T’s Query Profiler and check for missing indexes
- Make sure you have indexes on fields in your collection that you regularly query against using Studio 3T’s Index Manager. You can create compound indexes if your query searches multiple fields.
- Drop any unused indexes using Studio 3T’s Index Manager. Unused indexes slow down performance when MongoDB inserts or modifies documents.
- Limit the number of query results to return if you know the number of results you want by using the limit field in Studio 3T’s Collection Tab.
- Use projections to return only the necessary data by specifying the required fields in Studio 3T’s Visual Query Builder.
- Use index hints to force MongoDB to use a particular index when running your query, especially if the field is included in more than one index.
Query Profiler for finding, investigating, and fixing slow queries
Studio 3T’s Query Profiler detects slow queries and collects profiling data using MongoDB’s Database Profiler.

It shows you all you need to know about slow queries, neatly presently in one place, for example how long the query took to run, when the query ran, how often the query ran, and who ran the query. You can isolate potential problem queries by narrowing down the profiling data to a given time period or filtering by collection.
To investigate slow queries, take a look at the number of keys examined, which shows you how many index entries were scanned. If it’s zero, that’s a good indication that there aren’t any indexes on that collection and MongoDB is performing costly collection scans.
You can view the query code that MongoDB ran and open the code to fix your slow queries in Studio 3T’s editors:
- Collection Tab where your find query opens in a query bar, so that you can quickly edit projection, limit parameters, and more
- Aggregation Editor where each stage in the pipeline of your aggregation query is displayed separately, ready for you to debug and test
- IntelliShell where you can edit the query code using mongo shell language
Index Manager for optimizing indexing strategies
Indexes store the value of a field or a set of fields. With the right indexes, you can limit the number of documents that MongoDB reads and improve performance with more efficient querying. Studio 3T’s Index Manager allows you to easily create indexes or optimize and edit existing indexes by changing the indexed fields.
You can also see at a glance how often MongoDB indexes are used for all the indexes on a particular collection. If you see that you have any unused indexes, you can quickly drop them to improve database performance.

So that you can go through rapid iterations of index tuning, Studio 3T’s Index Manager has a toggle so that you can hide an index. Hiding an index means that you can carry out performance testing without having to drop and recreate the index, which is not only costly on your database resources but saves you having to wait around for your indexes to rebuild.
Visual explain for a step-by-step view of how a query is processed
Studio 3T’s Visual Explain is a visual representation of how the MongoDB query engine has processed a query. It shows all the stages in the query plan in the order they were executed, with performance statistics for each stage, so that you can fine tune and speed up each stage of your MongoDB query.

Visual Explain shows you whether MongoDB has performed a collection scan or index scan, so that you can immediately get to work on optimizing your indexing strategy. You can see how many documents are passed from one stage to the next stage and an estimate of memory usage for each particular stage.
Fixing slow queries with Studio 3T’s performance tools
Now that we’ve explained what each of the tools does, it’s time to pull it all together and show you how the tools work together to fix slow running queries and speed up performance.
Watch the video below for a run-thru demonstrating the steps you should follow to find, investigate, and fix a slow query:


