The Collection Tab is the starting point in Studio 3T for you to view collection data in MongoDB. You can access AI Helper, Visual Query Builder, and other features associated with the current collection.
The Collection Tab shows the contents of a MongoDB collection, ready for you to explore and analyze your data. It’s made up of the AI Helper, the Visual Query Builder, the Main Query Bar, the Result Tab, the Query Code tab, and the Explain tab.
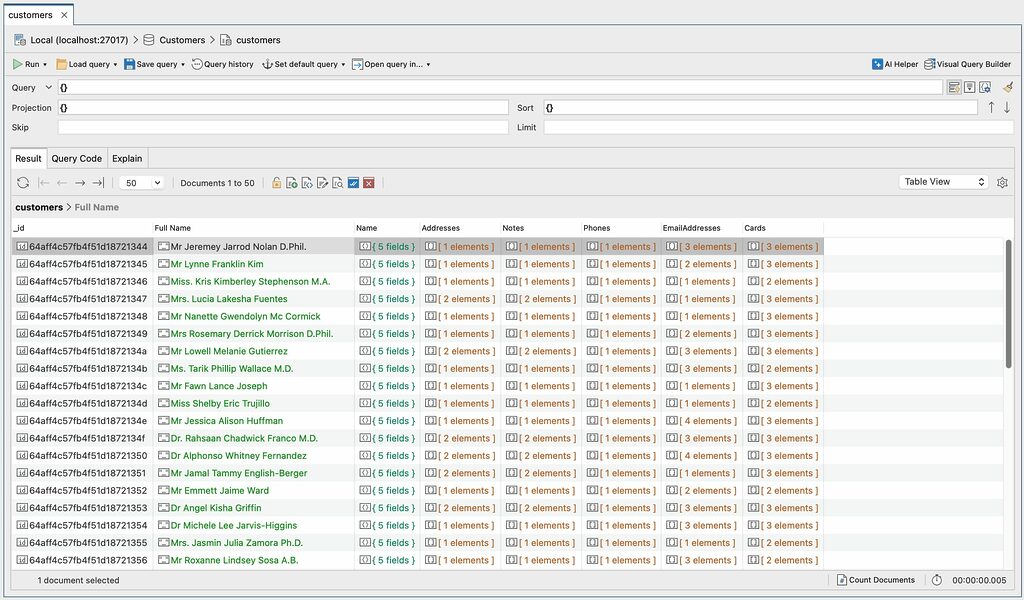
In MongoDB, a collection is a group of documents, similar to a table in a SQL database. The screenshot above shows a Collection Tab with documents from the customers collection. You can download the customers collection and explore the MongoDB data in this collection to follow along the examples in this article.
AI Helper
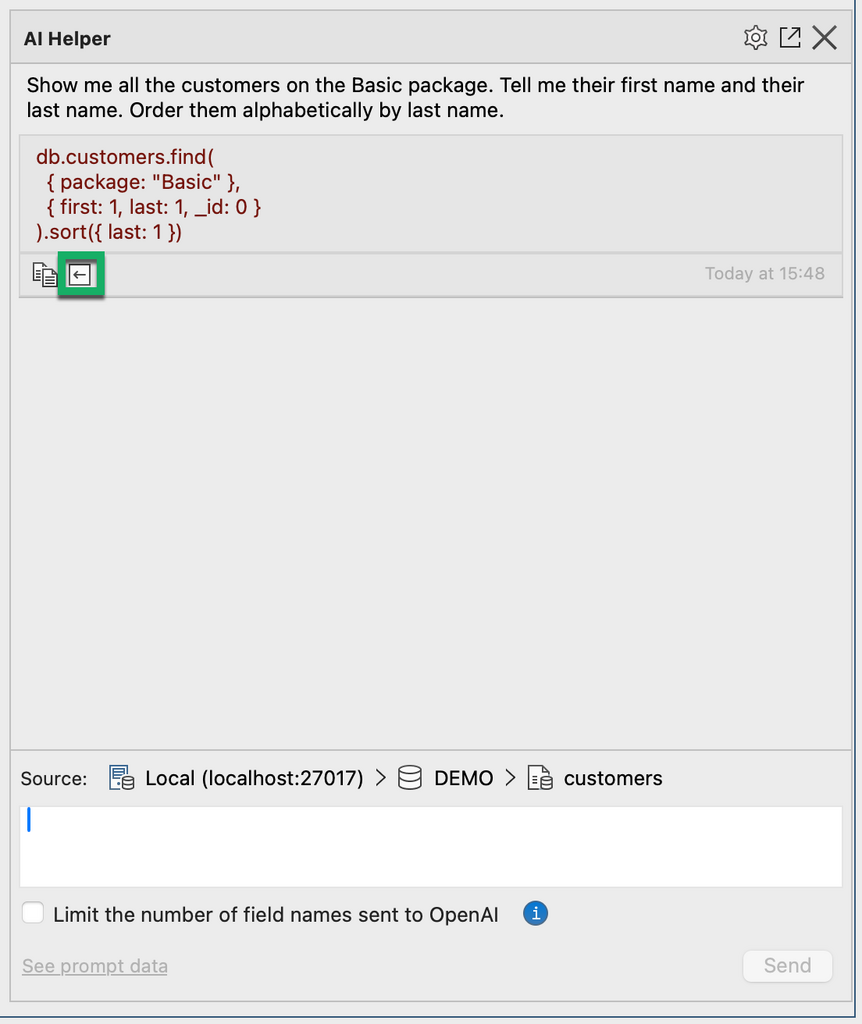
AI Helper is Studio 3T’s AI-powered assistant where you can ask questions about your MongoDB data in your native natural language. When you send a question from within the Collection Tab to your AI model, Studio 3T responds with a MongoDB find query. You can use this response in the Query Bar and continue writing your query, then run it in the Collection Tab.
Learn more about AI-powered query generation and how to set up AI Helper.
Visual Query Builder
The Visual Query Builder helps you create MongoDB queries using drag and drop. Simply drag the desired fields over to the query builder, drop them, set the operators, run the query, and start to explore your MongoDB data. It supports all MongoDB operators and field types.
As you build the query, the equivalent query in mongo shell syntax is displayed in the Main Query Bar.
Main Query Bar
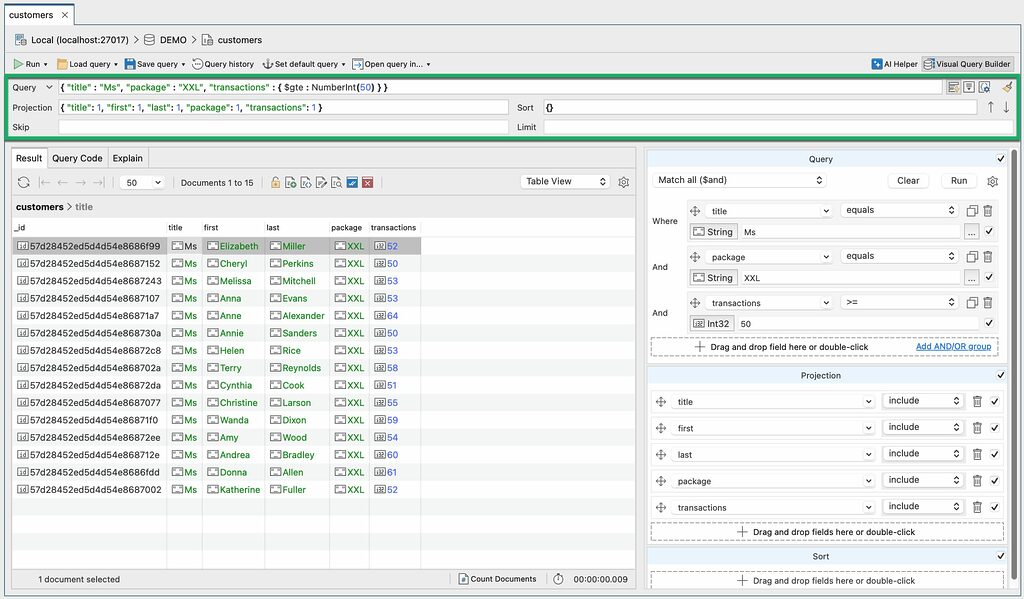
The Main Query Bar mirrors the query you’re creating in the Visual Query Builder in JSON format. If you’re new to MongoDB this helps you become familiar with reading and writing JSON so that you can write your own MongoDB queries.
The Main Query Bar includes the Query, Projection, Sort, Skip, and Limit fields. You can type your query criteria in these fields and the Query, Projection, and Sort text fields have built-in auto-completion for pairs of curly braces { }, brackets [ ], single and double quotation marks, and parentheses. Studio 3T colors the syntax in these fields as you type, making it easier to read, write, and debug. To clear all the fields in the Main Query Bar, click the broom button.
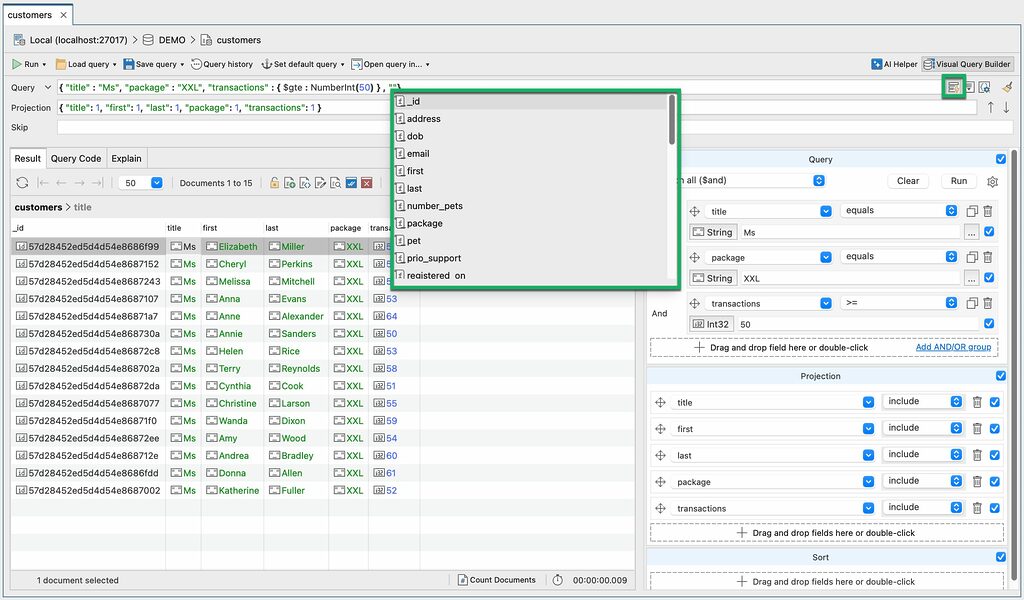
The auto-completion box suggests field names, operators, and data type wrappers. You can activate the auto-completion box by placing the cursor inside the curly braces { } and pressing Ctrl + Space (^ + Space). To turn auto-suggestions on or off, click the button to the right of the Query field. This toggle also controls auto-suggestions in the Query JSON Editor.
The Main Query Bar supports the following shorthand options in the Query field for searches on the MongoDB _id field:
- ObjectId (either single or double quoted). If you type
57d28452ed5d4d54e8686f9d
in the Query field and press Enter, it is auto-expanded to
{ "_id" : ObjectId("57d28452ed5d4d54e8686f9d") }
- UUID (either single or double quoted). If you type
C37E3CBA-8FAF-4923-818A-09D92AB56182
in the Query field and press Enter, it is auto-expanded to
{ "_id" : UUID("C37E3CBA-8FAF-4923-818A-09D92AB56182") }
- Integer. If you type
9876543210
in the Query field and press Enter, it is auto-expanded to
{ "_id" : 9876543210 }
- A single or doubled quoted string. If you type
"2020-12-12"
in the Query field and press Enter, it is auto-expanded to
{ "_id" : "2020-12-12" }
Query with date tags
Date tags are a shorthand way of querying a date field with a time range, for example today or last week. Using date tags saves you from having to perform calculations with the MongoDB Date() function. When Studio 3T runs the query, it converts the date tag into a range using the greater and less than operators, for example
"registered_on": #today
is converted as shown in the query code below:
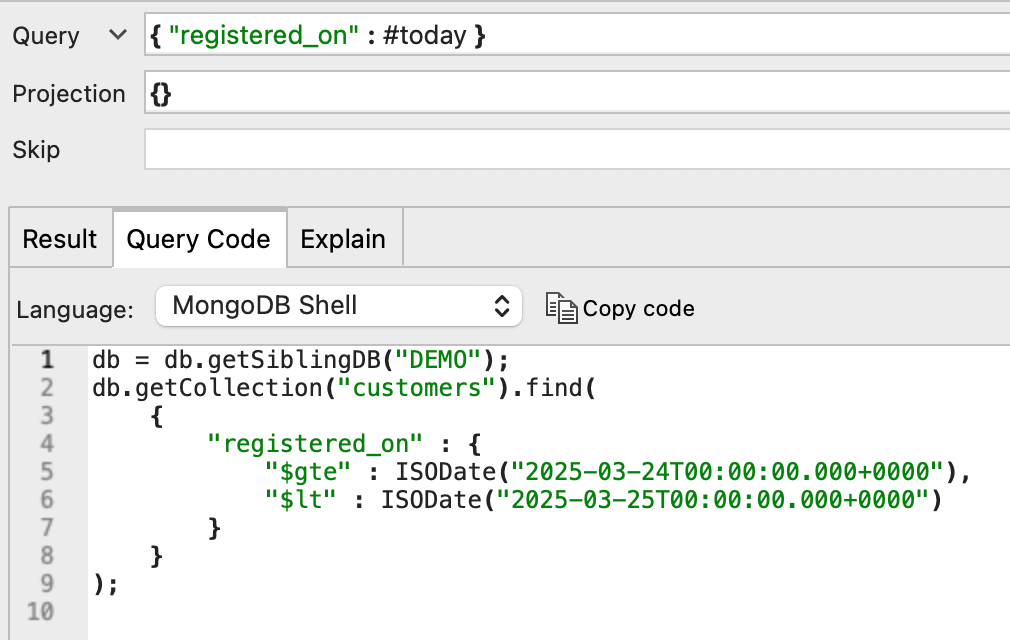
Learn more about Date Tags, including a list of all the available date tags.
The Query JSON Editor (“Multi-line Editor Tool”)
While the Main Query Bar shows only parts of a query, the Query JSON Editor displays the entire query in JSON. You can edit the query as if you were using the mongo shell.
To open the Query JSON Editor, click the button to the right of the Query field in the Main Query Bar.
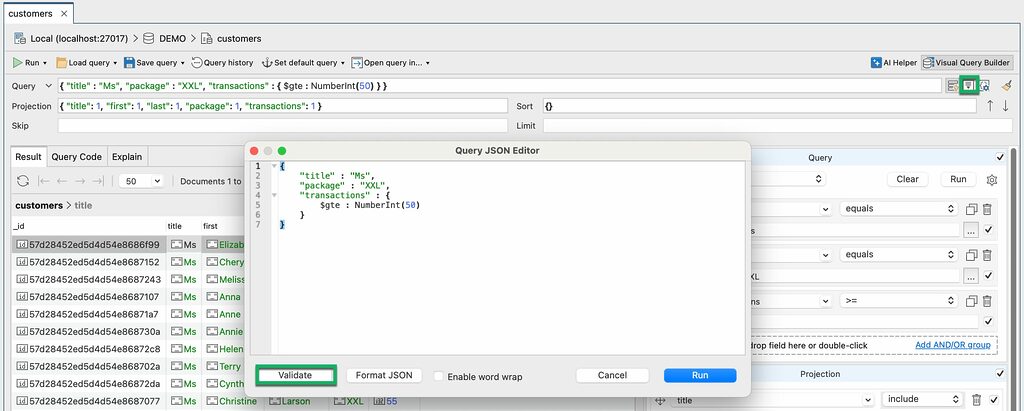
Click Validate to double-check the code and ensure your query is correctly built.
Run queries
The Run button runs the query on the respective collection. Additionally, this button contains a dropdown menu with other options:
- findOne(…) – returns a single document that matches the query criteria
- count(…) – returns the number of documents that match the query criteria
Load queries
To open saved queries:
- Click on the Load query icon or press Ctrl + O (⌘+ O) to search for your query in the Query browser
- Click the Load query arrow button to select a query from the list and load it in the Main Query Bar
- Click the Load query arrow button and select Open Query Manager to search for your query in the Query Manager
Save queries
To save your query so that you can use it throughout Studio 3T:
- Button – Click on the Save query icon.
- Shortcuts – Save query – Ctrl + S (⌘+ S)
If you are using Studio 3T’s Team Sharing, you can save your query in a shared folder. You and your team members can access the shared script from the My resources sidebar. To prevent other team members from editing your query, select the Make query read-only checkbox.

To store the connection and database details with your query, select the Save target details checkbox.
View query history
Whenever you run a query in Studio 3T, it is automatically saved in the query history. To view your query history and preview the details of the queries you ran, click Query history in the toolbar.
Open queries
To open the query you’re working on in another part of the Studio 3T application, in the toolbar click Open query in and select:
- Aggregation Editor to convert the current find query to an aggregation query with stages
- IntelliShell to work on the query as mongo shell code
For example, if you realize that you need to fetch data from another collection, you can’t do that with a simple find query in the Collection Tab. Studio 3T can convert any filters and projections to stages in an aggregation pipeline for you and you can continue writing your query in the Aggregation Editor without having to start from scratch.
Result Tab
The Result Tab shows the MongoDB collection data from your query. You can use Tree View, Table View, or JSON View to view query results and edit document data.
Tree View
Tree View shows the query results in a hierarchical format. You can edit the data in-place by double-clicking a cell. You can also open a multi-line editor by clicking the ellipsis button after you double-click a cell. Read more about Tree View.
Table View
Table View sorts the query results into columns and rows similar to a spreadsheet and enables custom views of embedded documents and arrays. As with Tree View, you can edit the data in-place by double-clicking a cell. You can also open a multi-line editor by clicking the ellipsis button after you double-click a cell. Read more about Table View.
JSON View
JSON View shows the query results as JSON documents that you can scroll through to explore your MongoDB data. To edit the data, select the target document and press Ctrl + J (⌘+ J) to open the Document JSON Editor dialog. Read more about JSON view.
The Result Tab Toolbar

Update Dialog
The Update Documents dialog allows you to modify several documents at a time. It is equivalent to the db.collection.updateMany() command in MongoDB.
To open the Update Documents dialog, right-click on any cell in Table View or Tree View and select Update Dialog.
It has two tabs: Query and Update.
The Query tab is where you write the query to find the documents you want to update.
You can choose to apply one of three predefined queries (all documents in the collection, selected documents in the collection, or the current results from the Collection Tab), but you can customize the query as needed in the editor.

The Update tab is where you write the command that you want to run against your target documents (as defined on the Query tab).

If Add documents updated through this operation to Collection History is selected, the documents are stored locally on your computer and you can restore the original values at a later date using the Collection History.
Click Validate JSON to debug, and then click Update to apply the changes.
Query Code
The Query Code tab allows you to convert queries into the following languages: JavaScript (Node.js), Java (2.x, 3.x, and 4.x driver API), C#, Python, PHP, Ruby, and the mongo shell language.
The Copy code button copies the code in the target language, so that you can paste driver code easily into your application.
Explain Tab
The Explain tab shows a visual representation of the steps MongoDB took to run your query. Click Run full explain to view the runtime statistics for each step. If you want to view the full output from the explain ( ) method, click View JSON.

Learn more about Visual Explain, and how you can use it to optimize MongoDB query performance.
This article was originally published by Dakota Karlsson and has since been updated.