In this tutorial, you’ll use the SQL Query tool to retrieve data from the welsh_pubs collection, which contains document data about pubs in Wales and their regional districts, called local authorities. You’ll run a SQL aggregate query that returns the number of pubs in each local authority.
To run the SQL query
1. Launch Studio 3T and connect to MongoDB Atlas.
2. Add the pubs database, add the welsh_pubs collection to the database, and add the documents in the welsh_pubs.json file to the collection.
3. In the Connection tree, right click the welsh_pubs collection node and click Open SQL.
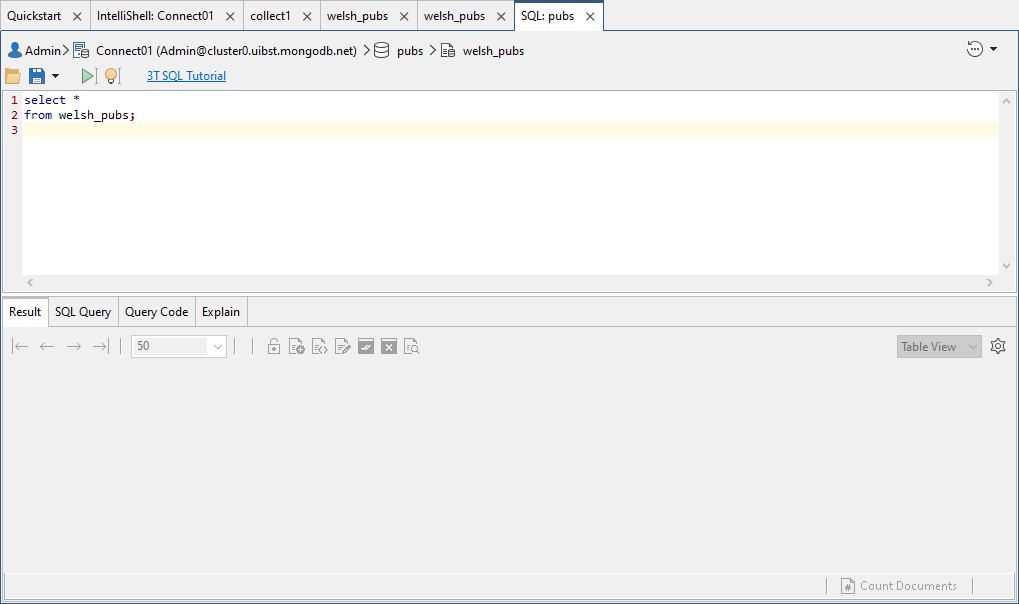
This launches the SQL Query tool, which opens a new tab, as shown in the following figure.
The SQL tab is divided into two sections.
The top section provides a command prompt for running SQL commands. When you first open the SQL tab, the command prompt is prepopulated with a SELECT statement that retrieves all data from the current collection. In this case, the statement is specific to the welsh_pubs collection, as shown in the following code:
select *
from welsh_pubs;
The bottom section of the SQL tab is similar to the bottom section of a collection tab, except that it also includes the SQL Query tab, which displays the SQL query associated with the current results.
4. Click the run button on the toolbar above the command prompt ( ).
).
Studio 3T displays the query results in the Result tab in the lower section.
The collection should include 3,122 documents.
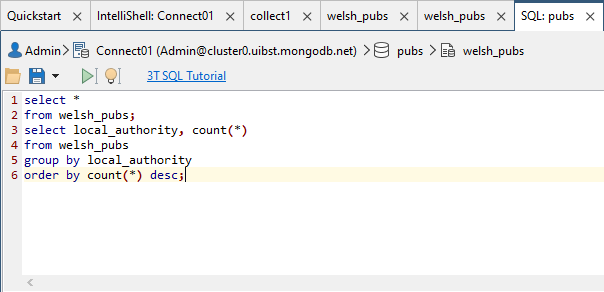
5. Copy and paste the following SQL statement to the SQL Query command prompt, on the line below the existing SQL statement:
select local_authority, count(*)
from welsh_pubs
group by local_authority
order by count(*) desc;
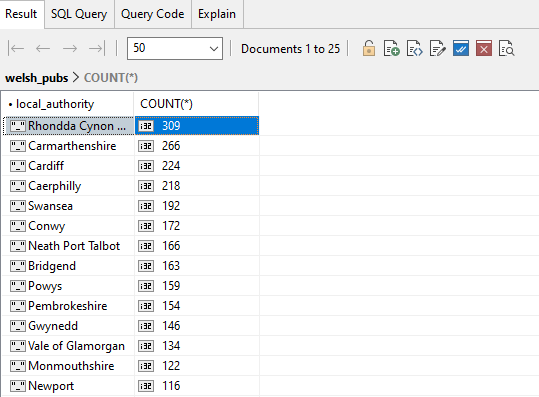
The SQL statement groups the document data by the local authorities and then calculates the total number of pubs for each authority. The statement also sorts the results by the number of pubs, with the highest number first.
6. Select the recently-added SQL statement in the command prompt and click the run button.
Your query results should look similar to those in the following figure.


