In this exercise, you’ll export the mongo shell version of your SQL aggregate query to the Aggregation Editor, where you’ll review the components that make up the aggregate pipeline. You’ll then run the query and view the results.
To export the SQL query
1. Go to the Query Code tab in the bottom section of the SQL tab.
2. Verify that the mongo shell option is selected in the Language drop-down list.
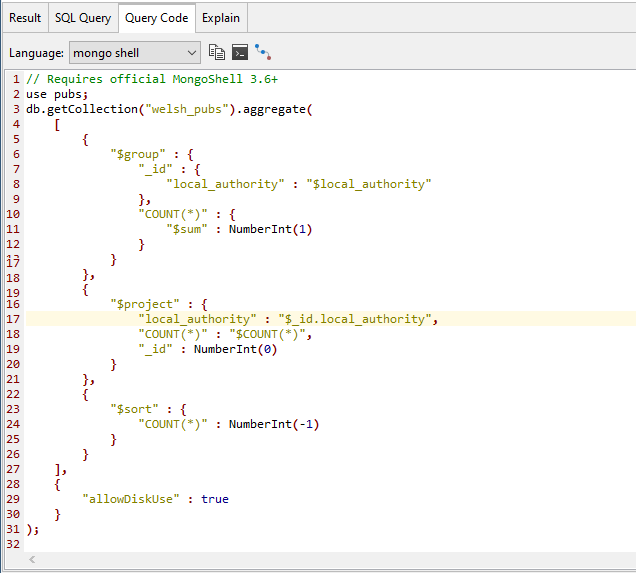
Studio 3T automatically converts your SQL statement to the selected language, as shown in the following figure.
The mongo shell code includes the aggregate method, which is called on the welsh_pubs collection object.
The $group, $project, and $sort operators are passed in as arguments to the aggregate method.
Each operator carries out a specific task in the aggregate pipeline. If you were to run this code in IntelliShell, you should get the same results as running the original SQL statement.
3. At the top of the Query Code tab, click the Open query in Aggregation Editor button (![]() ).
).
This launches the Aggregation Editor in its own tab in the main window.
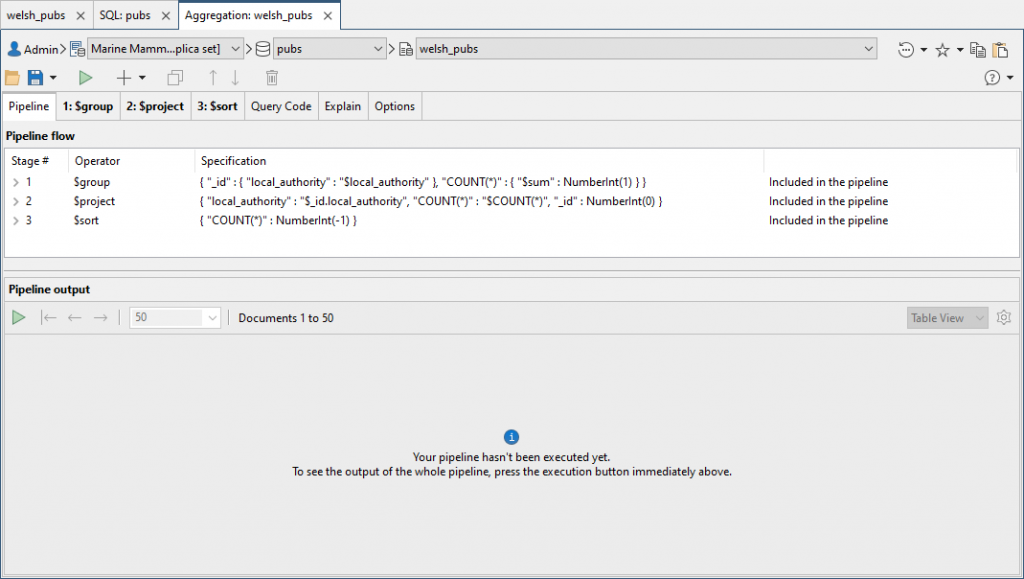
The Aggregation tab shows the aggregate query imported from the SQL tab, with the query broken down into three individual stages, as shown in the following figure.
Like the SQL tab, the Aggregation tab is separated into two sections.
The Pipeline flow section shows the components that make up the aggregate pipeline, separated into multiple tabs:
- The Pipeline tab provides an overview of the individual stages. Each stage is associated with an aggregate operator. You can expand a stage to view the code associated with the operator that defines the action for that stage.
- A Stage tab is displayed for each stage in the pipeline. Here you can specify the aggregate operator to use for that stage and update the code associated with that operator.
- The Query Code tab shows the mongo shell code for the current aggregation. The tab can also convert the code to other languages such as JavaScript, Java, C#, Python, PHP and Ruby.
- The Options tab provides options for writing aggregate operations to temporary files and for configuring a custom collation.
- The Explain tab provides a visual representation of the steps that MongoDB took to execute the query.
The bottom section is the Pipeline output section, where you can view the output of the full pipeline.
4. Click the run button on the toolbar. In this case, the button displays the tooltip Execute the entire pipeline (![]() ).
).
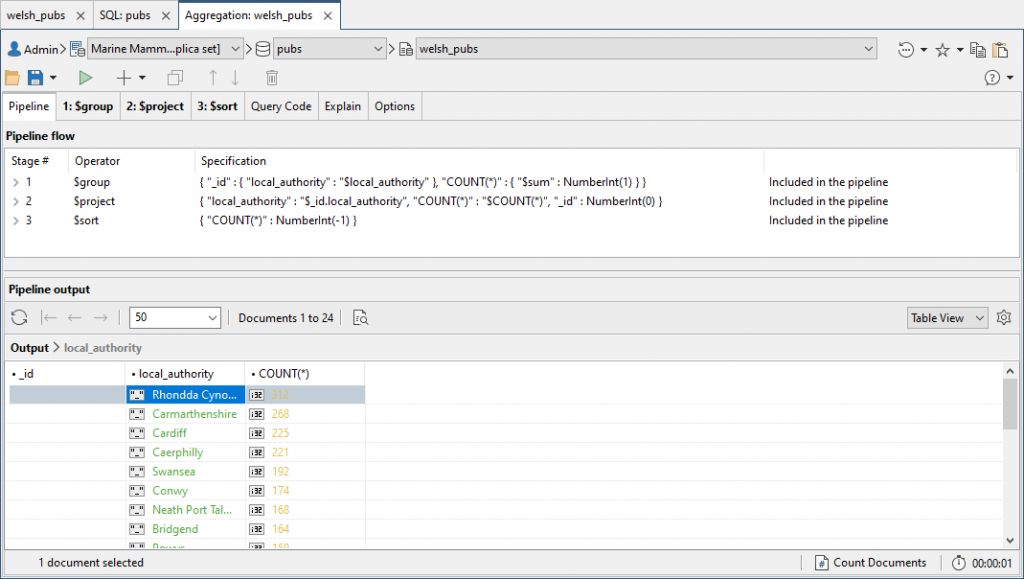
Studio 3T runs the aggregate query and displays the results in the Full Pipeline tab in the bottom section, as shown in the following figure.
5. Leave the Aggregation tab open for the next exercise, with the current pipeline configuration in place.


