With any type of database, you will sometimes face a problem when you are reporting aggregations.
Maybe you are reporting on trading performance and want to break it down a number of different ways to spot trends or anomalies. You have to do some preparation work on the data and then run several reports, or aggregations on that intermediate collection or table that you’ve prepared.
With SQL, you have to prepare a temporary table and then do your repeated aggregation GROUP BY queries on that table. Sometimes you can do it with a virtual table in a Common Table Expression. Occasionally you just shrug and process the preparation work every time, using maybe a table-valued function or view.
In a previous article, I’ve shown how to make a temporary collection for this purpose in MongoDB, but there is a much neater and faster way of doing it. It is the $facet stage of an aggregation.
The $facet stage
To understand how it works, and how it can be so useful, it is far easier to try things out on some very simple real data.
In a previous article, How to Clean Up MongoDB Data Using Aggregation and Regex, I created such a practice database. I attached the database to that article so you can play along. The database just holds the rainfall data for Southeast England from 1931. Here is a sample of the individual documents. I showed some of the basic aggregations that one could do.

The MongoDB stage $facet lets you run several independent pipelines within the stage of a pipeline, all using the same data. This means that you can run several aggregations with the same preliminary stages, and successive stages.
It is called ‘facet’ because it is also used in commerce to guide the analysis of sales by a range of factors or ‘facets’.
The commonest time you need to do something like this with a database is when you need to have column and row totals and grand totals. They are really separate calculations, but you need them all in one collection, and you’d expect to achieve it in one calculation.
The advantage of this stage is that input documents are passed to the $facet stage only once.
Here we not only do the calculations, but do it for the three different pivot tables, for rainfall totals, average rainfall and max rainfall.
db.getCollection("DailyRainfall").aggregate(

    // Pipeline
    [
        // Stage 1
        {
            $addFields: {
                "Month" : {
                    "$month" : "$Date"
                },
                "Year" : {
                    "$year" : "$Date"
                },
                "MonthYear" : {
                    "$dateToString" : {
                        "format" : "%m:%Y",
                        "date" : "$Date"
                    }
                }
            }
        },

        // Stage 2
        {
            $facet: {// grand totals for the entire series
                 "Totals": [
                 {
                        "$group" : {
                            "_id" : null,
                            "averageRain" : {
                                "$avg" : "$Rainfall"
                            },
                            "maxRain" : {
                                "$max" : "$Rainfall"
                            },
                            "totalRain" : {
                                "$sum" : "$Rainfall"
                            }
                        }
                 }
                 ],
            // column totals getting aggregation fo each month
                 "Monthly": [
                 {
                        "$group" : {
                            "_id" : "$Month",
                            "averageRain" : {
                                "$avg" : "$Rainfall"
                            },"Rainfall" : {
                                "$sum" : "$Rainfall"
                            },
                            "maxRain" : {
                                "$max" : "$Rainfall"
                            }
                        }
                 },{"$sort" : {"_id":1}}
                 ],
            // get the aggreegation for Rain by year (row total)
                 "Yearly": [
                 {
                        "$group" : {
                            "_id" : "$Year",
                            "averageRain" : {
                                "$avg" : "$Rainfall"
                            },"Rainfall" : {
                                "$sum" : "$Rainfall"
                            },
                            "maxRain" : {
                                "$max" : "$Rainfall"
                            }
                        }
                 },{"$sort" : {"_id":1}}
                 ],
            // Cell level data
                 "MonthYear": [
                 {
                        "$group" : {
                            "_id" : "$MonthYear",
                            "averageRain" : {
                                "$avg" : "$Rainfall"
                            },"Rainfall" : {
                                "$sum" : "$Rainfall"
                            },
                            "maxRain" : {
                                "$max" : "$Rainfall"
                            }
                        }
                 },{"$sort" : {"_id":1}}
                 ]

            }
        },

    ]
This will seem odd at first glance. We seem to have four separate group stages within a single stage. Actually, they are pipelines, as we’ve shown by adding a $sort substage.
The first stage did the preparatory work to allow us to do simple groupings and we then forked into four different pipelines that processed the same input set of documents.
In the single output document, each sub-pipeline has its own field where its results are stored as an array of documents. We could have ended up with a single pipeline that tidied it all up and presented it in a more human-oriented way. This $facet stage is powerful.
The $bucket stage
The $bucket aggregation can provide some features that are hard to do any other way. The term ‘bucket’ is from histogram theory, and the $bucket is ideal for doing frequency distributions.
Here is a typical bucket histogram used on our rainfall data:
db.getCollection("DailyRainfall").aggregate(

    // Pipeline
    [
        // Stage 1
        {
            $bucket: {
                groupBy: "$Rainfall", // group by daily rainfall
                boundaries: [ 0,5,10,15,20,25,30,35,40,45 ],
                default: "Above 45", // just in case!
                output: { count: { $sum: 1 } } // the number in each category
            }
        },

    ]

);

You can see that there were 27481 days with under 5mm of rain, 2879 days where it rained lightly between 5 and 10 mm, 943 days with between 10 and 15 mm of rain, and so on to 4 days with over 40 mm of rain.
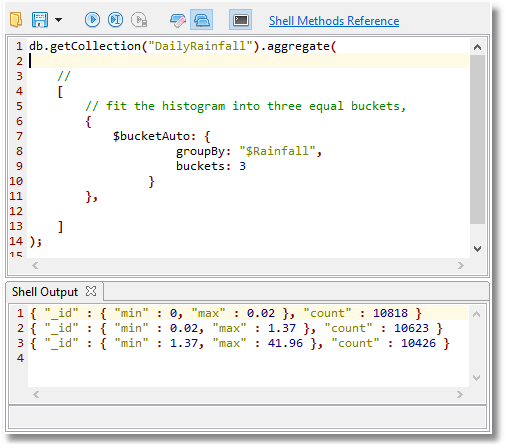
There is a variant of the $bucket called $bucketAuto where MongoDB attempts to change the size of the buckets to fit the distribution of the values.
This is easiest demonstrated:

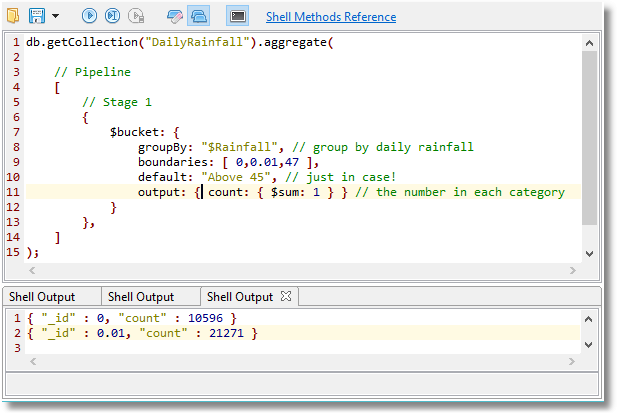
This tells you that it rains roughly two days out of three in south-eastern Britain, but for two days out of three you might miss it unless you were staring out of the window a lot. In fact it is one day in three that it rains in southeast Britain as we can quickly prove:

We can use the MongoDB facet and bucket stages together. In fact you can use almost all the pipeline stages with the $facet stage within a sub-pipeline. Here we do three analyses, including our precious example, that are tricky to do any other way.
db.getCollection("DailyRainfall").aggregate(

    // Pipeline
    [
        // Stage 1
        {
            $addFields: {
               Month: { $month: "$Date" },Year: { $year: "$Date" }
            }
        },

        // Stage 2
        {
            $facet: {// average rainfall and max rainfall of the series
                 // the weather by the quarter
                 "ByQuarter": [
                     {
                      $bucket: {
                        groupBy: "$Month",
                        boundaries: [ 0,4,7,10,13],
                        default: "Other",
                        output: {
                          "TotalRainfall": { $sum: "$Rainfall" }
                        }
                      }
                    }
                  ],
             //The weather for each decade
                       "ByDecade": [
                     {
                      $bucket: {
                        groupBy: "$Year",
                        boundaries: [1930, 1940, 1950, 1960, 1970, 1980, 1990, 2000, 2010, 2020],
                        default: "later",
                        output: {
                          "TotalRainfall": {$sum: "$Rainfall" },
                          "MaxRainfall": {$max: "$Rainfall" },
                          "AvgRainfall": {$avg: "$Rainfall" }
                        }
                      }
                    }
                  ],
             //The histogram for weather
                       "Rainfall Frequency": [
                     {
                      $bucket: {
                            groupBy: "$Rainfall", // group by daily rainfall
                            boundaries: [0, 5, 10, 15, 20, 25, 30, 35, 40, 45],
                            default: "Above 45", // just in case!
                            output: { count: { $sum: 1 } } // the number in each category
                        }
                     }
                  ]

            }
        },

    ]


);
The beauty of the $bucket becomes apparent when you have a lot of independent variables, and you wish to explore the relationships between them, and investigate their distribution. There is a lot of useful information that can be explored, and it makes a lot of sense to do the pipelines in parallel.
When developing a $facet stage, I find it much easier to create each pipeline independently, with a copy of the preceding stages. This means that each sub-pipeline can be written and tested in the Aggregation Editor of Studio 3T, and then spliced into the $facet.
Conclusions
The MongoDB facet stage is best considered a general way of making aggregations more efficient by allowing the same intermediate set of documents to be processed by a number of pipelines before the results are then fed back into the original pipeline. It means that the initial stage is done only once. Where the initial stage takes a lot of effort to construct, this makes sense.


