In this exercise, you’ll create a simple query to retrieve the document you created in the previous exercise (the document whose last field value is Grey).
You’ll then use features on the Collection Tab to display the document in different views.
To view a document in Table, Tree or JSON View
1. Open the customers collection tab if it’s not already open.
2. In the query form at the top of the tab, type the following expression in the Query text box (deleting the existing curly braces, if necessary):
{ "last": "Grey" }

The expression defines a simple search condition for retrieving any documents in the collection whose last field value is Grey. In this case, only one document contains this value, the one you added in the first exercise.
3. Click the Run query button (![]() ) to the right of the Query text box. The query should return the record whose last value is Grey.
) to the right of the Query text box. The query should return the record whose last value is Grey.
4. On the Result tab, select the document returned by your query, and then click the View Document button (![]() ) on the Result tab toolbar.
) on the Result tab toolbar.
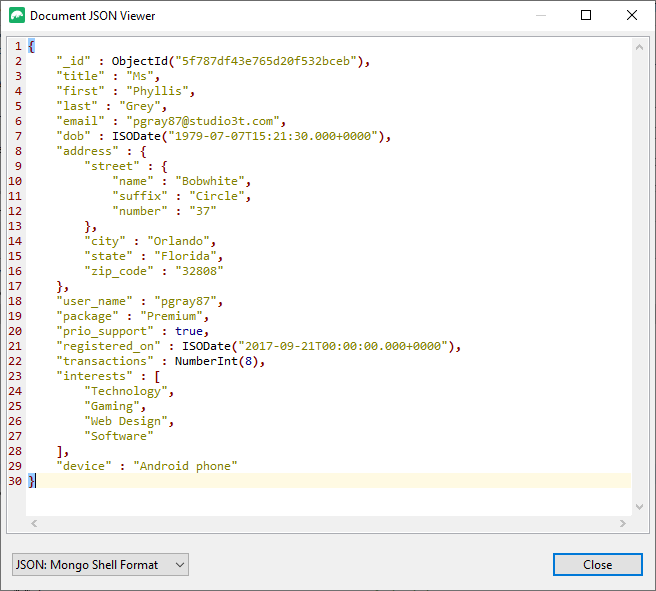
Studio 3T launches the Document JSON Viewer dialog box, which displays the document’s JSON code, as shown in the following figure.
You can display the code in different JSON formats by selecting the desired option from the drop-down list in the bottom left corner. The figure shows the default view, Mongo Shell Format.
5. Click the Close button to close the Document JSON Viewer dialog box.
6. On the Result tab, select JSON View from the drop-down list to the right of the toolbar. The following figure shows the document in JSON View, which is similar to how the document appears in the Document JSON Viewer dialog box.
7. On the Result tab, select Table View from the drop-down list to the right of the toolbar, and then double-click the interests field. The Result tab displays the values in that array, providing you with another alternative for reading the data, as shown in the following figure.

You can return to the record’s top level by clicking customers in the breadcrumb, which is just below the Result tab toolbar. From there, you can drill into the address field to view its embedded fields.
8. On the Result tab, select Tree View from the drop-down list to the right of the toolbar, and then expand the fields. The record should now look similar to the following figure.

Tree View is handy for displaying individual records because it provides a quick overview of the field hierarchy, along with an easy-to-understand list of fields, values, and data types.
9. Leave the record in place for the next exercise, with the fields expanded in Tree View.


