Skip to content
Studio 3T - The professional GUI, IDE and client for MongoDB
  • Tools
    • Aggregation Editor
    • IntelliShell
    • Visual Query Builder
    • Export Wizard
    • Import Wizard
    • Query Code
    • SQL Query
    • Connect
    • Schema Explorer
    • Compare
    • SQL ⇔ MongoDB Migration
    • Data Masking
    • Task Scheduler
    • Reschema
    • More Tools and Features
  • Solutions
  • Resources
    • Knowledge Base
    • MongoDB Tutorials & Courses
    • Tool/Feature Documentation
    • Blog
    • Community
    • Testimonials
    • Whitepapers
    • Reports
  • Contact us
    • Contact
    • Sales Support
    • Feedback and Support
    • Careers
    • About Us
  • Store
    • Buy Now
    • Preferred Resellers
    • Team Pricing
  • Download
  • My 3T
search

Academy 3T

  • Explore our courses
    • MongoDB 101: Getting Started
    • MongoDB 201: Querying MongoDB Data
    • MongoDB 301: Aggregation
  • Get certified

Reporting with Studio 3T Aggregations

MongoDB 301: Aggregation Reporting with Studio 3T Aggregations

MongoDB aggregations provide an effective method for summarizing data in order to identify trends, understand changes over time, and in other ways gain insights into that data. Studio 3T makes it easy to create a wide range of aggregations, especially with the help of the Aggregation Editor. But aggregations are useful only if analysts, decision-makers, and other key players can access and understand that information. Fortunately, Studio 3T provides multiple tools to help you get the data into the hands of the people who need it.

In this section, you’ll learn how to use Studio 3T features to make your aggregated data available to other users and applications. You’ll start by saving the results of an aggregation query to a view. You’ll also export a collection to a .csv file and then open the file in Microsoft Excel, where you can organize and visualize the data. In addition, you’ll learn how to use MongoDB Charts to visualize data in a collection you create in Studio 3T.

By the end of this section, you will learn how to

  • Create a view based on an aggregation query
  • Export a collection as a .csv file for use by a third-party tool
  • Visualize collection data in MongoDB Charts

What you will need

  • Ability to download a .json file from the internet
  • Ability to open a .csv file in Microsoft Excel
  • Access to a MongoDB Atlas cluster and to MongoDB Charts

Making aggregated data available to users and applications

A MongoDB view is a database object that can be queried just like a collection, except that the view does not persist the data. You can think of a view as a saved query, similar to views in a relational database. When a client application queries the view, MongoDB runs the query and returns the results. 

A view provides an easy way to enable applications to access aggregated data without needing to write complex queries. A view also limits an application’s visibility into a database, restricting access to only a specific subset of data in a collection, rather than exposing the entire collection.

The Aggregation Editor in Studio 3T makes it very easy to create a view based on the active aggregate statement. After you build your statement and ensure that it returns the desired results, you can create a view in a few simple steps: right-click anywhere in the Pipeline flow window or Pipeline output window, click Create view from this Aggregate Query, provide a name for the view, and click OK.

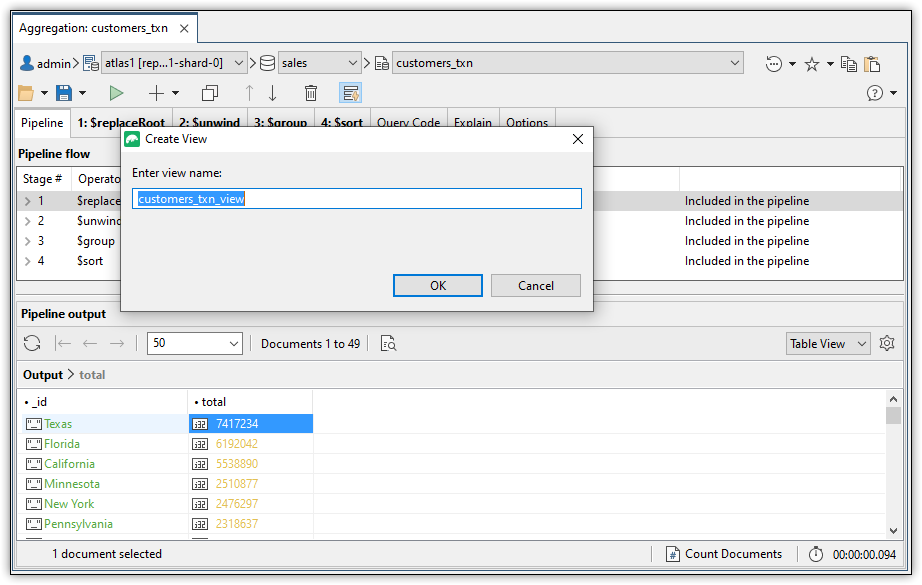
That’s all there is to creating a view. After that, an authorized user or application can retrieve data from that view by running a simple find operation. In this way, an organization can provide the aggregated data to the people who need it, whether the data is delivered through a dashboard, an embedded report, a visualization tool, or some other mechanism.

In addition to views, Studio 3T also makes it easy to export collection data to the CSV format, as well as to formats such as JSON or SQL. The CSV format is especially handy because of its universal nature, having been used by countless applications over the years to exchange data. For example, you can export a collection as a .csv file and then open the file in Microsoft Excel, where you can format, filter, and sort the data, as well as create rich visualizations based on that data. You can also use .csv files to import data into applications such as Tableau, Salesforce, Zoho Analytics, SAP Analytics Cloud, Microsoft Power BI Desktop, and many others.

To export a collection’s data to a .csv file, you need only right-click the collection in the Connection Tree and click Export Collection, which launches the Export wizard. In the wizard’s first screen, you select the CSV option and then click Configure, which opens the Export tab, as shown in the following figure.

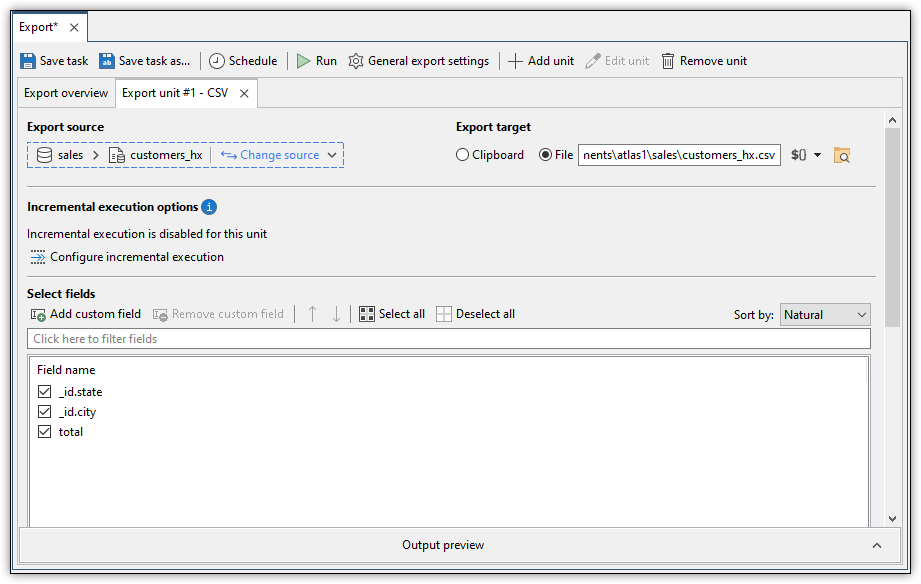
On this tab, you can configure a number of settings that control how the data is exported to the .csv file. For example, you can select which fields to include, what type of delimiter to use (instead of the default comma), how to encapsulate complex values, which record separator to use, and other settings. Studio 3T will then save the file to the designated location, where you can make it available to Excel or other applications for visualizing the data or working with it in other ways.

Another option for visualizing collection data is to take advantage of MongoDB Charts, which provides a user-friendly interface for creating visualizations based on MongoDB data. The tool lets you create a wide range of charts that provide quick insights into the underlying data. If you’re already connected to MongoDB Atlas when creating your collections in Studio 3T, those collections are automatically available to MongoDB Charts, making it easy to start visualizing data directly through your browser.

See also
  • MongoDB aggregation made easy
  • How to Create a MongoDB View
  • Export Wizard
  • MongoDB Charts

Lesson Content
0% Complete 0/3 Steps
Exercise 1: Creating a view based on an aggregation query
Exercise 2: Exporting a collection as a .csv file for use by a third-party tool
Exercise 3: Visualizing collection data in MongoDB Charts
Reporting with Studio 3T Aggregations: Test your skills
Previous Lesson
Back to Course
Next Topic
  • Course Home Expand All
    Building a Basic Aggregation
    4 Topics | 1 Quiz
    Exercise 1: Filtering the documents in the aggregation pipeline
    Exercise 2: Grouping the documents in the aggregation pipeline
    Exercise 3: Sorting the documents in the aggregation pipeline
    Exercise 4: Adding processing options to the aggregation
    Building a Basic Aggregation: Test your skills
    Introducing the Aggregation Editor
    4 Topics | 1 Quiz
    Exercise 1: Importing an aggregate statement into the Aggregation Editor
    Exercise 2: Replace a field in the aggregation pipeline
    Exercise 3: Reorder the fields in the aggregation pipeline
    Exercise 4: Changing the sort order in the aggregation pipeline
    Introducing the Aggregation Editor: Test your skills
    Working with Arrays in the Aggregation Pipeline
    5 Topics | 1 Quiz
    Exercise 1: Using expression operators to filter input documents
    Exercise 2: Unwinding an array to create individual documents
    Exercise 3: Grouping array values and generating a document count for each group
    Exercise 4: Writing pipeline results to a new collection
    Working with Arrays in the Aggregation Pipeline: Test your skills
    MongoDB 301 Mid-Course Feedback
    Adding Lookup Data to the Aggregation Pipeline
    4 Topics | 1 Quiz
    Exercise 1: Adding lookup data to the aggregation pipeline
    Exercise 2: Converting string values in one of the lookup fields to integers
    Exercise 3: Adding a computed ratio field based on the converted lookup field
    Exercise 4: Limiting the number of returned documents
    Adding Lookup Data to the Aggregation Pipeline: Test your skills
    Working with Reschema for MongoDB
    4 Topics | 1 Quiz
    Exercise 1: Setting up a reschema unit that includes lookup data
    Exercise 2: Defining a target collection in the reschema unit
    Exercise 3: Adding and scheduling a task to create the target collection
    Exercise 4: Running an aggregate statement against the target collection
    Working with Reschema for MongoDB: Test your skills
    Reporting with Studio 3T Aggregations
    3 Topics | 1 Quiz
    Exercise 1: Creating a view based on an aggregation query
    Exercise 2: Exporting a collection as a .csv file for use by a third-party tool
    Exercise 3: Visualizing collection data in MongoDB Charts
    Reporting with Studio 3T Aggregations: Test your skills
    Course Extras
    Return to MongoDB 301: Aggregation
  • Studio 3T

    MongoDB Enterprise Certified Technology PartnerSince 2014, 3T has been helping thousands of MongoDB developers and administrators with their everyday jobs by providing the finest MongoDB tools on the market. We guarantee the best compatibility with current and legacy releases of MongoDB, continue to deliver new features with every new software release, and provide high quality support.

    Find us on FacebookFind us on TwitterFind us on YouTubeFind us on LinkedIn

    Education

    • Free MongoDB Tutorials
    • Connect to MongoDB
    • Connect to MongoDB Atlas
    • Import Data to MongoDB
    • Export MongoDB Data
    • Build Aggregation Queries
    • Query MongoDB with SQL
    • Migrate from SQL to MongoDB

    Resources

    • Feedback and Support
    • Sales Support
    • Knowledge Base
    • FAQ
    • Reports
    • White Papers
    • Testimonials
    • Discounts

    Company

    • About Us
    • Blog
    • Careers
    • Legal
    • Press
    • Privacy Policy
    • EULA

    © 2023 3T Software Labs Ltd. All rights reserved.

    • Privacy Policy
    • Cookie settings
    • Impressum

    We value your privacy

    With your consent, we and third-party providers use cookies and similar technologies on our website to analyse your use of our site for market research or advertising purposes ("analytics and marketing") and to provide you with additional functions (“functional”). This may result in the creation of pseudonymous usage profiles and the transfer of personal data to third countries, including the USA, which may have no adequate level of protection for the processing of personal data.

    By clicking “Accept all”, you consent to the storage of cookies and the processing of personal data for these purposes, including any transfers to third countries. By clicking on “Decline all”, you do not give your consent and we will only store cookies that are necessary for our website. You can customize the cookies we store on your device or change your selection at any time - thus also revoking your consent with effect for the future - under “Manage Cookies”, or “Cookie Settings” at the bottom of the page. You can find further information in our Privacy Policy.
    Accept all
    Decline all
    Manage cookies
    ✕

    Privacy Preference Center

    With your consent, we and third-party providers use cookies and similar technologies on our website to analyse your use of our site for market research or advertising purposes ("analytics and marketing") and to provide you with additional functions (“functional”). This may result in the creation of pseudonymous usage profiles and the transfer of personal data to third countries, including the USA, which may have no adequate level of protection for the processing of personal data. Please choose for which purposes you wish to give us your consent and store your preferences by clicking on “Accept selected”. You can find further information in our Privacy Policy.

    Accept all cookies

    Manage consent preferences

    Essential cookies are strictly necessary to provide an online service such as our website or a service on our website which you have requested. The website or service will not work without them.

    Performance cookies allow us to collect information such as number of visits and sources of traffic. This information is used in aggregate form to help us understand how our websites are being used, allowing us to improve both our website’s performance and your experience.

    Google Analytics

    Google Ads

    Bing Ads

    Facebook

    LinkedIn

    Quora

    Hotjar

    Functional cookies collect information about your preferences and choices and make using the website a lot easier and more relevant. Without these cookies, some of the site functionality may not work as intended.

    HubSpot

    Social media cookies are cookies used to share user behaviour information with a third-party social media platform. They may consequently effect how social media sites present you with information in the future.

    Accept selected