In this article, I’ll introduce the idea of MongoDB views, and why you might want to use them. I’ll provide a small practice database that I first introduced in a previous article. The idea is to encourage you to try them out, and illustrate the creation of views.
Although I usually try to keep the story interesting for anyone who hasn’t got Studio 3T, in this article, I’ll be basing things on Studio 3T because I’ll be ending up illustrating the value of views by using SQL Query, for which MongoDB hasn’t yet got the equivalent feature.
Views in MongoDB
Views in MongoDB are read-only, and they return a collection in much the same way as a find() or aggregation() would. They are similar to views in relational databases.
A view is the result of a stored aggregation on a collection, which database users can query just as if it were a persistent collection object. It is a virtual aggregation derived dynamically from data in a base collection. If you change the data in one or more documents of the base collection, these changes are reflected in the data shown in subsequent invocations of the view.
Why are views useful?
They are useful because they provide:
- Simpler application code – They allow the application code that obtains information from the database to be far simpler. Views can hide the complexity of code by joining and simplifying several collections into a single virtual collection. You need only call the view, or perhaps use it as part of an aggregation.
- Decoupling the database and application – The database developer can change the data within the database without always requiring changes from the application code, just by changing the view. It provides a form of interface to the application(s) using the database.
- Ease of performance tuning – When tuning a database, the developer can concentrate on the views, test them, and run them easily, in order to optimise their performance.
- Ease of use – They use exactly the same code as aggregations with a few minor restrictions.
- Code in one place – It gives an opportunity to prevent repeating your code in several places, which can make maintenance more difficult.
- Simple masking and security of data – A view can present to a user a subset of the data contained in a table. Consequently, a view can provide just the data that is appropriate for the role of the user. A role can query the view, but not the base collection. The Administrators can implement collection-level access control through user-defined roles.
- Economy of storage – Views take very little space to store; the MongoDB database contains only the definition of a view, not a copy of all the data that it represents.
- Simple exports – You can create JSON exports of views that enable you to exclude fields from, or add additional information to, the underlying collection when extracting data in JSON or CSV files from a database.
How do views relate to data aggregations?
In the last article, I introduced the idea of a data aggregation, and showed how it was an ideal way of providing data for reporting systems such as Excel.
Data aggregations provide a summary of the underlying documents and collections. They are the result, represented by a collection, of any database process that gathers, processes and aggregates data.
In MongoDB, it is generally the result of grouping and lookups within an aggregation pipeline. Unlike data aggregations, views represent the underlying data at the time they were called. They take less space to store, and do not require a scheduling system to keep them up-to-date. Views are better for volatile data, whereas data aggregations are best for reporting of past data.
Any interface between database and application would be wise to use both techniques – views and data aggregations – because they simplify performance tuning, make security easier to implement, decouple the development of the database and application(s) and make it easier to ‘mock’ the database during application testing.
Installing the sample database
We’re using a real database provided by the British Met Office as with the previous article. We’re using it to demonstrate simple MongoDB operations. We are using this data purely to help in the demonstration. Although it provides up-to-date data, almost all is unchanging historical information. You will have to imagine it being ‘data in motion’ as you might see in a shopping site, social media or trading organisation. We are constrained to use historic data for demonstration purposes.
The data is from the UK’s Met Office, recording southeast England rainfall since the 1930s. It is in plain text.
We’ll assume that either you have installed it while reading the previous article, or else you need to do it now. If you already have it, please skip the next paragraphs.
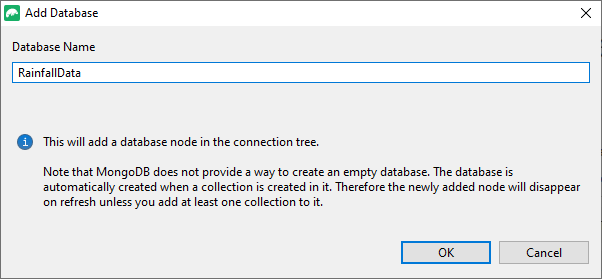
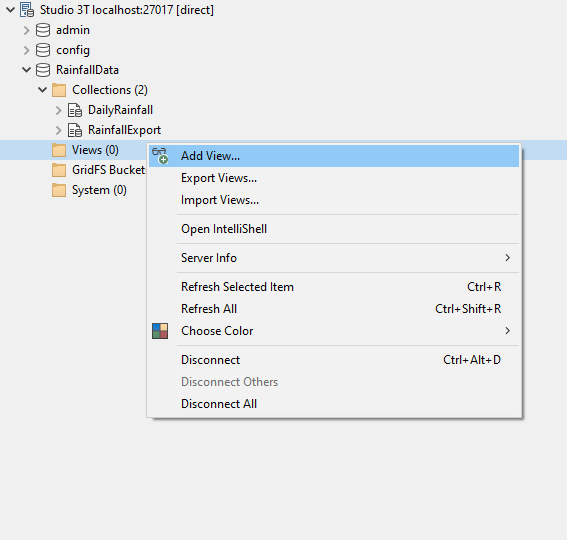
First, right-click on the connection in the browser pane of Studio 3T and in the subsequent context menu, click on ‘Add Database …’ to install the RainfallData database.
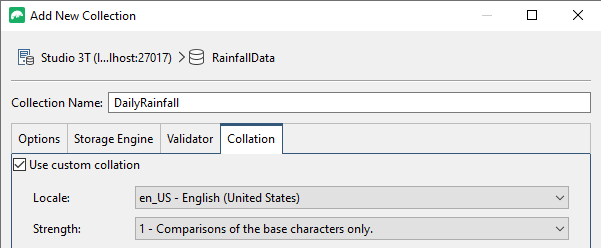
Now right-click on your new RainfallData database in the browser pane to get to the context menu that gives you the choice of ‘Add Collection …‘
Probably the only setting worth specifying is the collation, though we’ll do nothing that requires a case-insensitive collation.
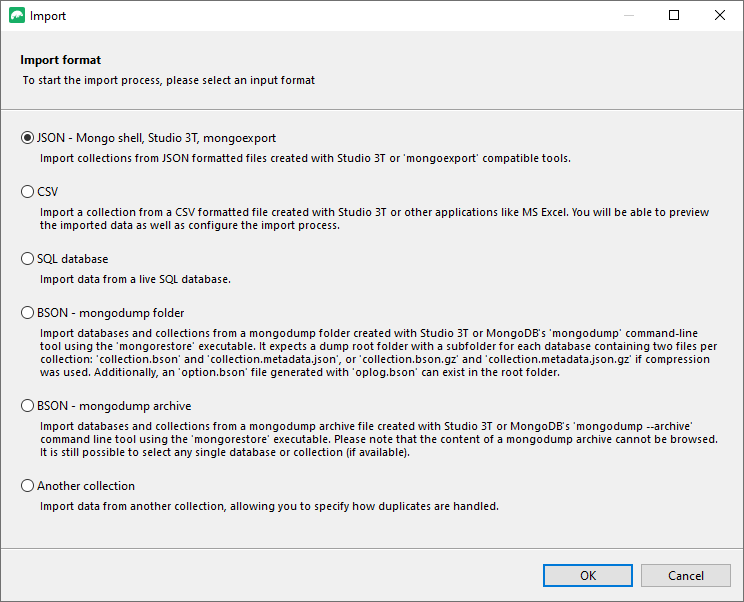
And on the next screen, specify a JSON import:
And then follow the wizard, step by step.
Repeat the process for the RainfallExport database.
You should end up with something like this:
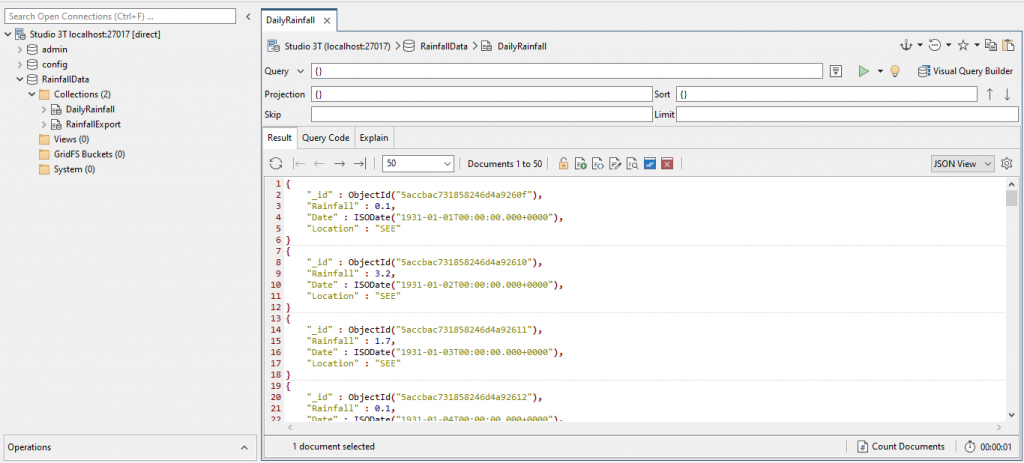
Notice the Operations pane that will tell you whether the import worked and how many documents you have. I’ve opened a collection tab just to see what is in the DailyRainfall collection.
I showed some simple aggregations in the previous article, so we can move straight to creating a view.
Creating our first view
We can imagine that, with this data, we will want the obvious reports that you get with any climate data, the maximum and minimum rainfall and when it happened.
This should be simple. All you need to do is to sort the DailyRainfall collection by rainfall amount (in millimetres) in descending order. We’ll create a view to do that.
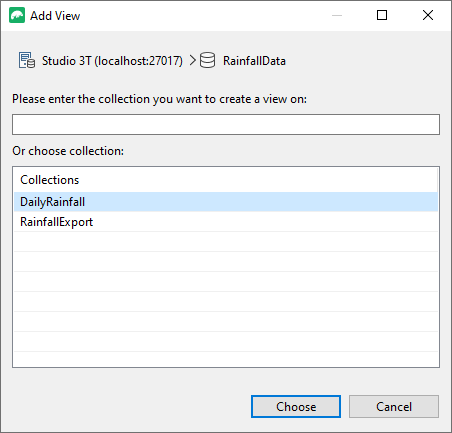
We choose a collection or view to base our view on:
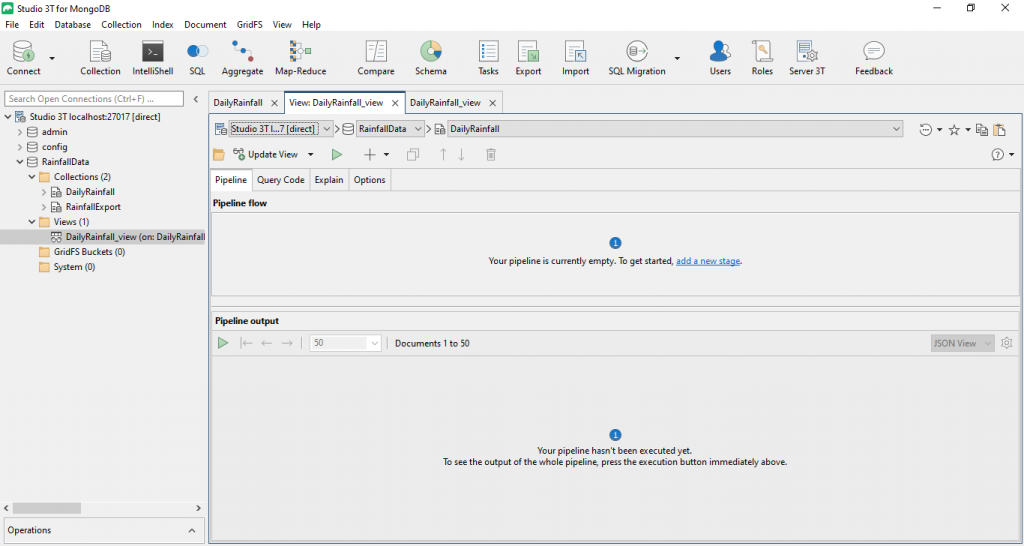
And we are presented with a view creation tab that looks similar to the Aggregation Editor.
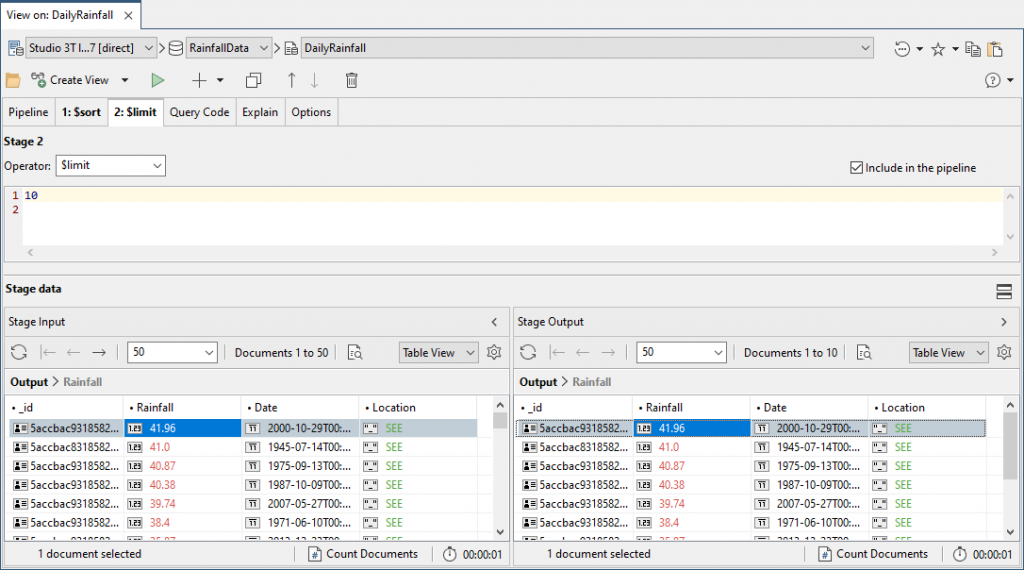
We create a first stage, and make it a $sort{} pipeline stage.
{
    "Rainfall": NumberInt(-1)
}
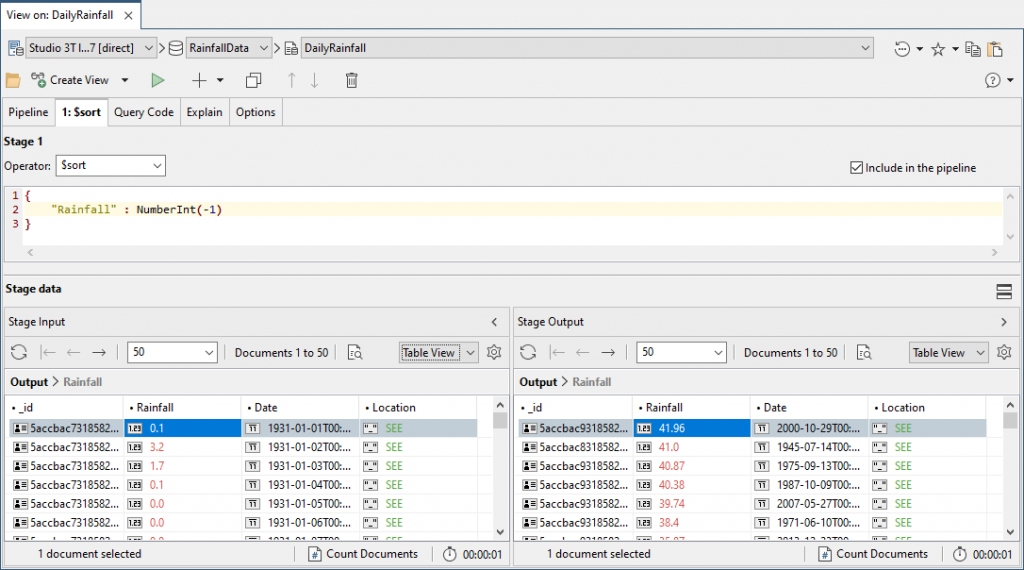
You can see what we have. We next want to limit it to the first ten, so we add a second stage and specify that it is a $limit. We check that it hasn’t just sorted the first ten records in the key order, which is an unfortunate optimisation that MongoDB sometimes attempts.
10
We quickly realise that this isn’t the most appealing report.
For a start, the rainfall figures are given as millimetres whereas a lot of people want good old inches. Also, that date isn’t very readable. We need a stage that tidies up the output to produce documents that are human-oriented.
Unfortunately, the result needs to be rounded to two decimal points and there is no suitable built-in way to do this in MongoDB. If anyone has suggestions for a quick and nimble way of doing it that doesn’t involve a function, please add to the comments below.
{
    TheDate: { $dateToString: { format: "%d/%m/%Y", date: "$Date" } },
    "Rainfall (mm)": "$Rainfall",
    "Rainfall (ins)": {
        "$divide": [
            "$Rainfall",
            25.4
        ]
    },
    _id: 0
}
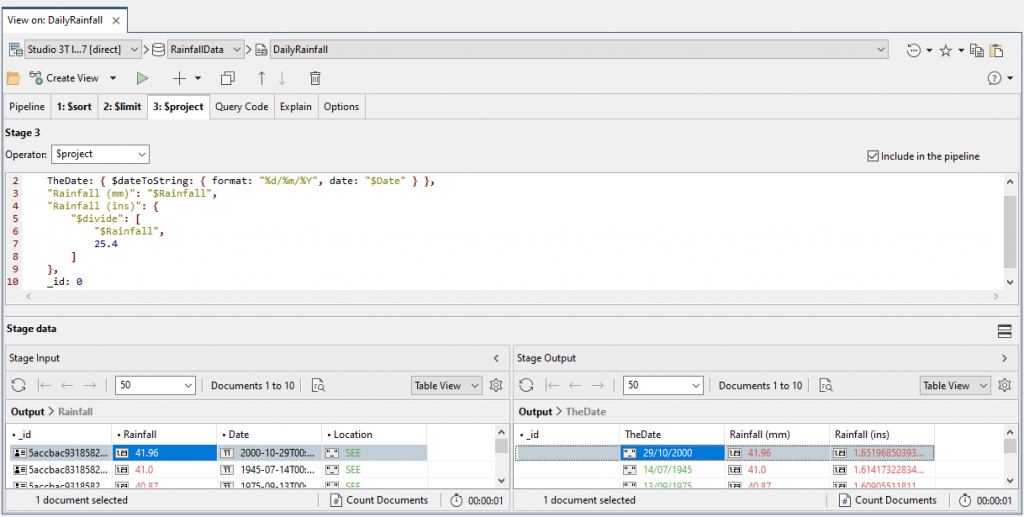
Current advice is to avoid having the $sort stage adjacent to a $limit stage so we can easily move this $project stage up the pipeline to chaperone the two other stages.
We can, of course find the driest days, but there are plenty of days with no rain at all. We could try to find the longest sequence of days without rain, but that is surprisingly complicated.
Finally, we save this view.
Views upon views
So now we have the peak rainfall days, we can easily find the top ten wettest months ever, and with hardly a change, the driest months. That thought tells us that it is time to create a view that provides an intermediate view for reports. By using it as the source of short and simple aggregate queries, we’re avoiding duplication of our work.
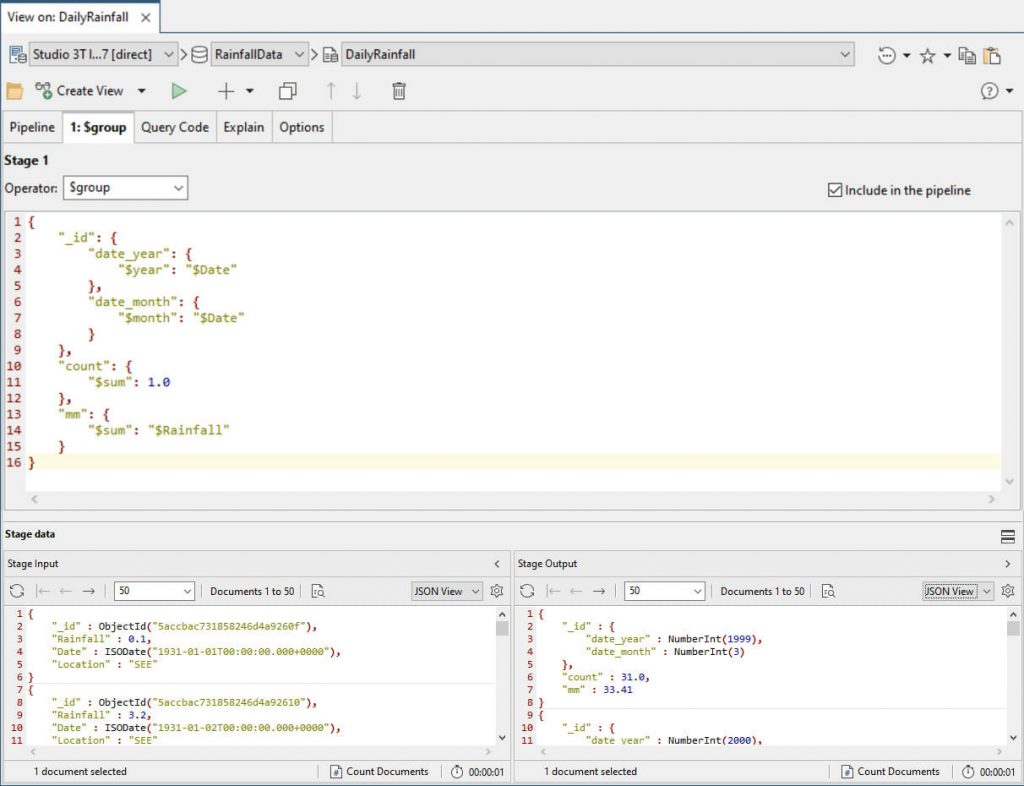
We start by grouping the data by year and month, so we can get the total rainfall for each month of each year.
{
    "_id": {
        "date_year": {
            "$year": "$Date"
        },
        "date_month": {
            "$month": "$Date"
        }
    },
    "count": {
        "$sum": 1.0
    },
    "mm": {
        "$sum": "$Rainfall"
    }
}
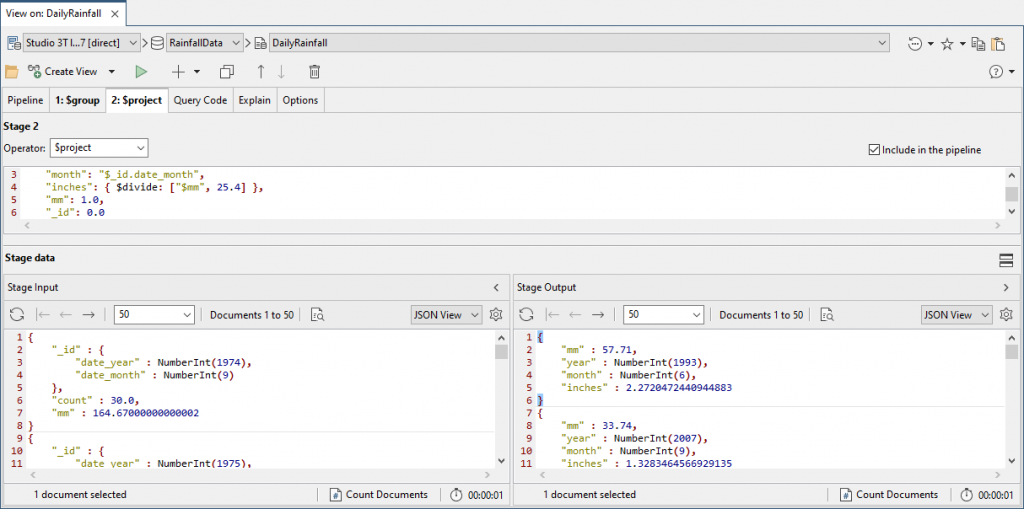
We can then calculate the rainfall in inches, and get the year and months as integers.
{
    "year": "$_id.date_year",
    "month": "$_id.date_month",
    "inches": { $divide: ["$mm", 25.4] },
    "mm": 1.0,
    "_id": 0.0
}
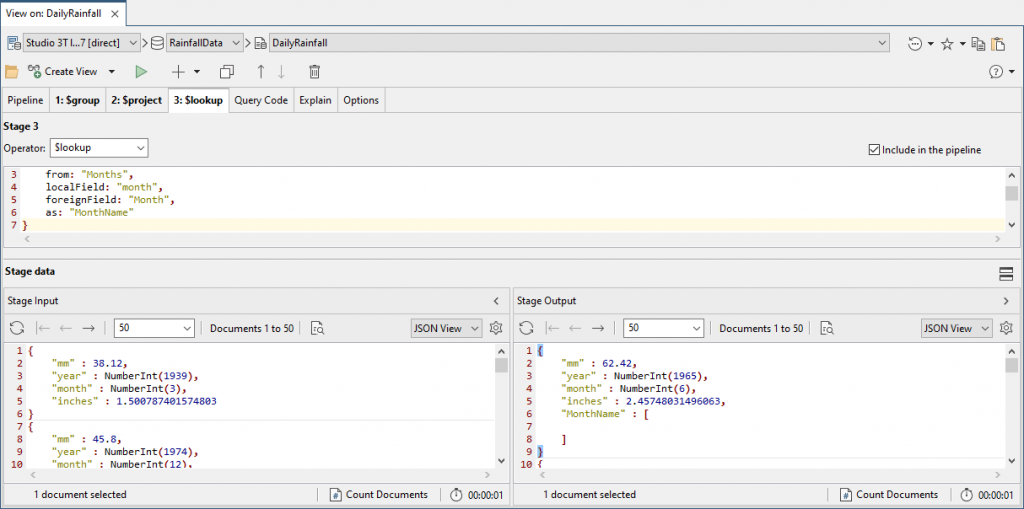
We’re doing fine, but working out what month corresponds with each integer is irritating when scanning data quickly, so we’ll interpret that into the names of the month by joining to a collection that lists them.
{
    from: "Months",
    localField: "month",
    foreignField: "Month",
    as: "MonthName"
}
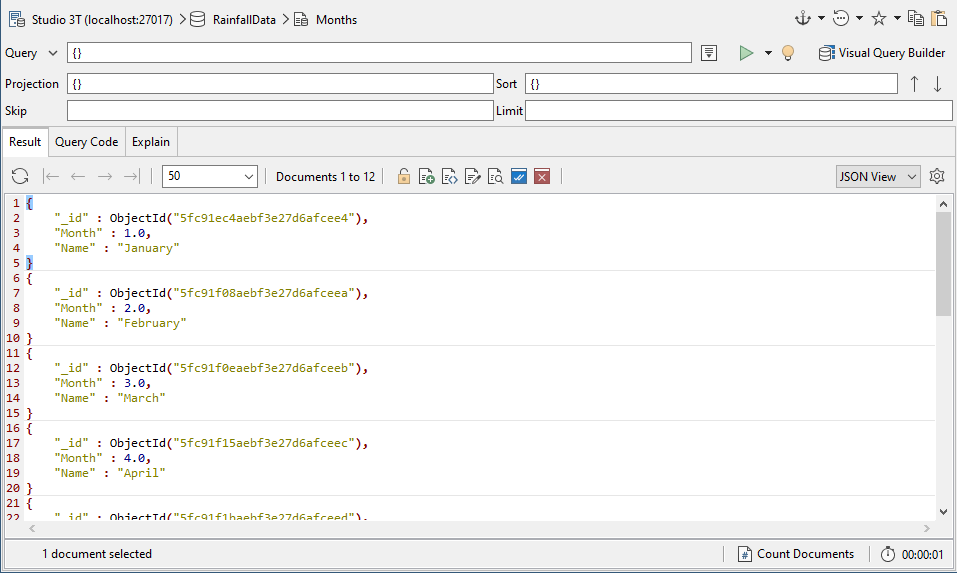
To make this collection of the names of months, we simply add a new collection, open the collection tab, and write each document.
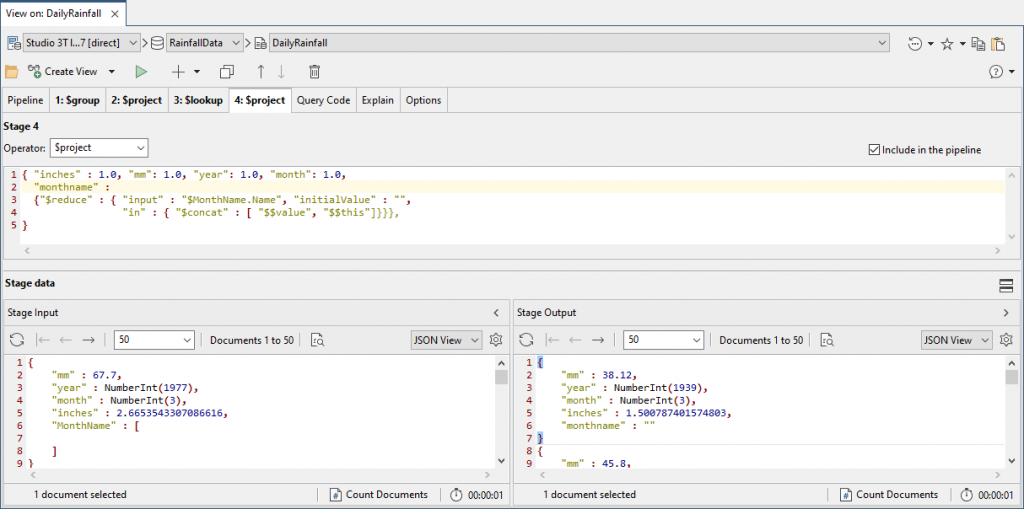
We don’t want the month in a separate array, so we pull it into a field using the $reduce function.
We can also quickly switch from JSON View to Table View for a clearer impression of how our results are coming on.
{
    "inches" : 1.0,
    "mm" : 1.0,
    "year" : 1.0,
    "month" : 1.0,
    "monthname" : {
        "$reduce" : {
            "input" : "$MonthName.Name",
            "initialValue" : " ",
            "in" : {
                "$concat" : [
                    "$value",
                    "$this"
                ]
            }
        }
    }
}
Now we add the full month name including the year.
{
    "inches": 1.0, "mm": 1.0, "year": 1.0, "month": 1.0, "monthname": 1,
    "monthdate": { $concat: ["$monthname", " ", { $substr: ["$year", 0, -1] }] }
}
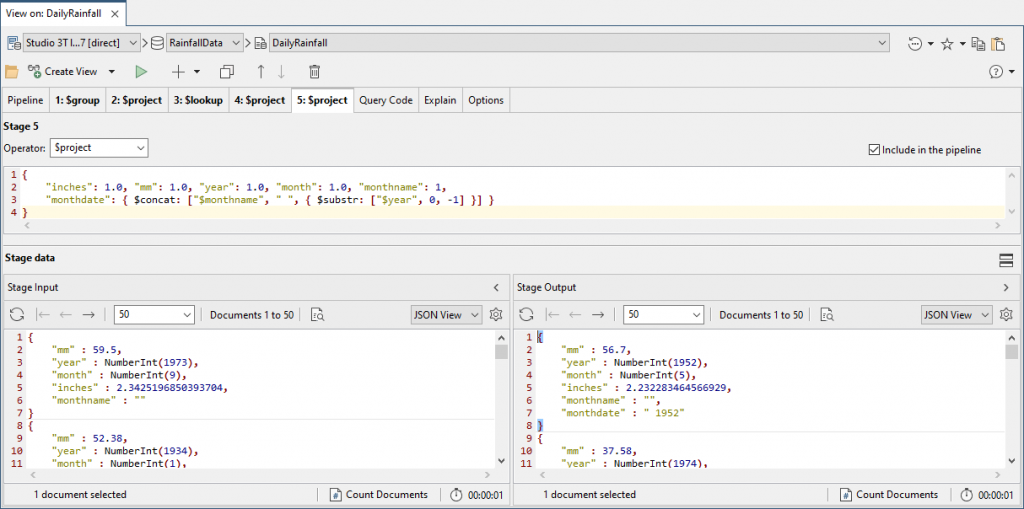
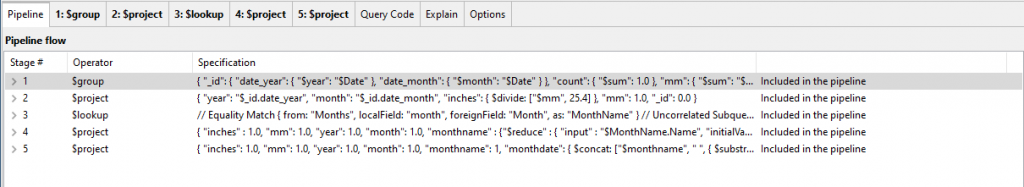
We can now save it as a view called ‘MonthlyRain’.
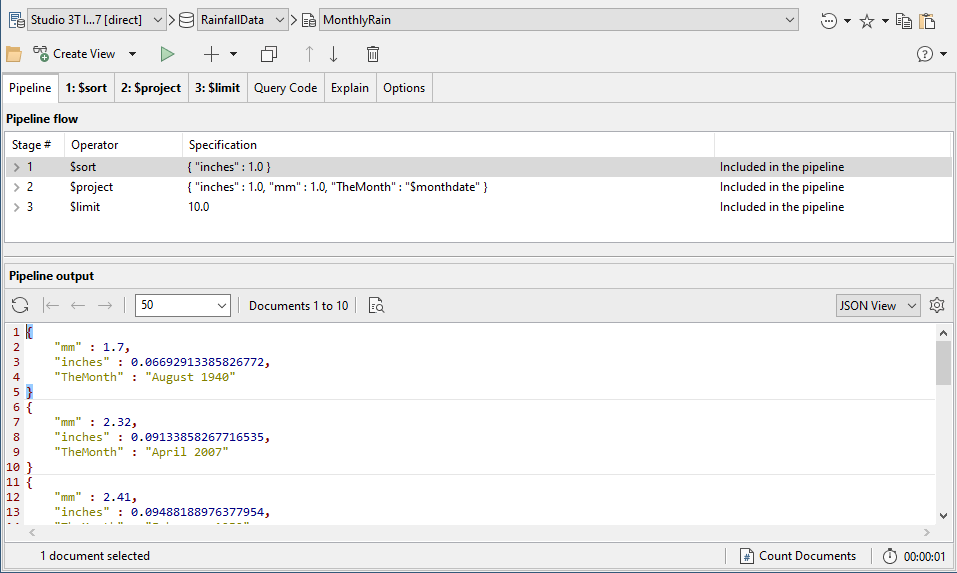
Now that we have this, we can immediately get the top ten wettest months. We can develop the code and save this as a view.
use RainfallData;
db.MonthlyRain.aggregate(
    [
        {
            "$sort" : {
                "inches" : -1.0
            }
        },
        {
            "$project" : {
                "inches" : 1.0,
                "mm" : 1.0,
                "TheMonth" : "$monthdate"
            }
        },
        {
            "$limit" : 10.0
        }
    ],
    {
        "allowDiskUse" : false //disables spooling to temporary files
    }
)
And the driest months are a matter of changing one item, the sort in the first stage is changed from a descending sort to an ascending sort.
As well as using the View tab, we can also use the Aggregation Editor, SQL Query, or even IntelliShell.
Here is code we’ve developed in the Aggregation Editor:
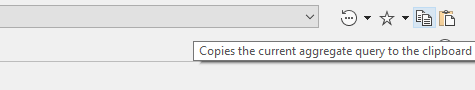
We can get the code from the Aggregation Editor and copy what we’ve done.
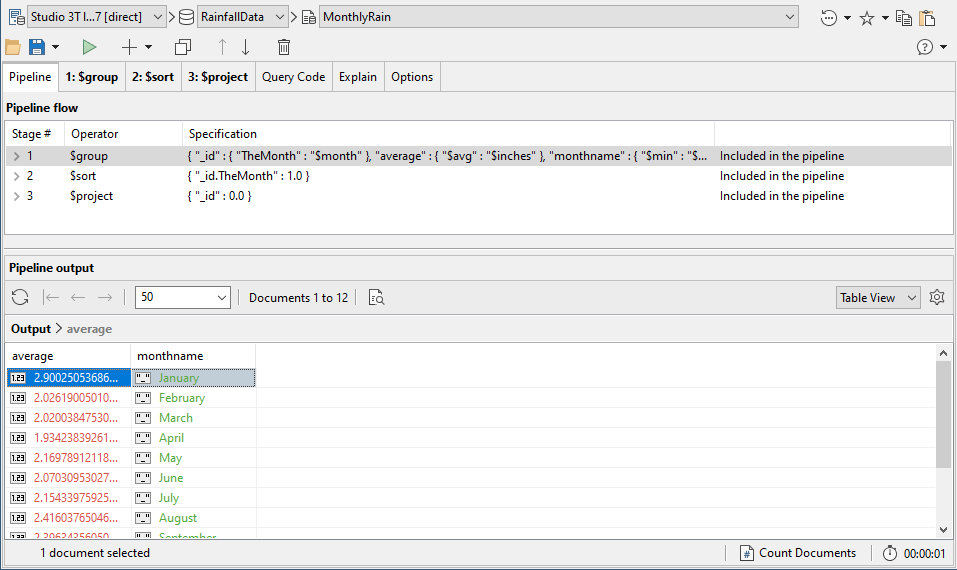
Now we can easily give the average rainfall per month for the entire 1930 to 2018 dataset from a view.
Here is the code version:
use RainfallData;
db.MonthlyRain.aggregate(
    [
        {
            "$group" : {
                "_id" : {
                    "TheMonth" : "$month"
                },
                "average" : {
                    "$avg" : "$inches"
                },
                "monthname" : {
                    "$min" : "$monthname"
                }
            }
        },
        {
            "$sort" : {
                "_id.TheMonth" : 1.0
            }
        },
        {
            "$project" : {
                "_id" : 0.0
            }
        }
    ],
    {
        "allowDiskUse" : false
    }
);
You can copy this code and paste it into a new View tab and save it as a view.
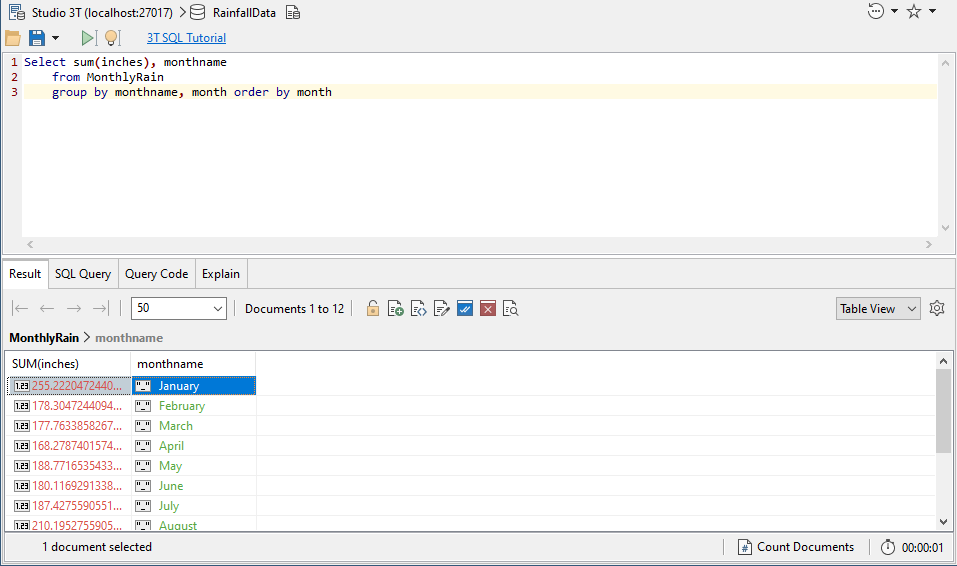
It is also easier to use the SQL Query feature for queries to get the total rain per month:
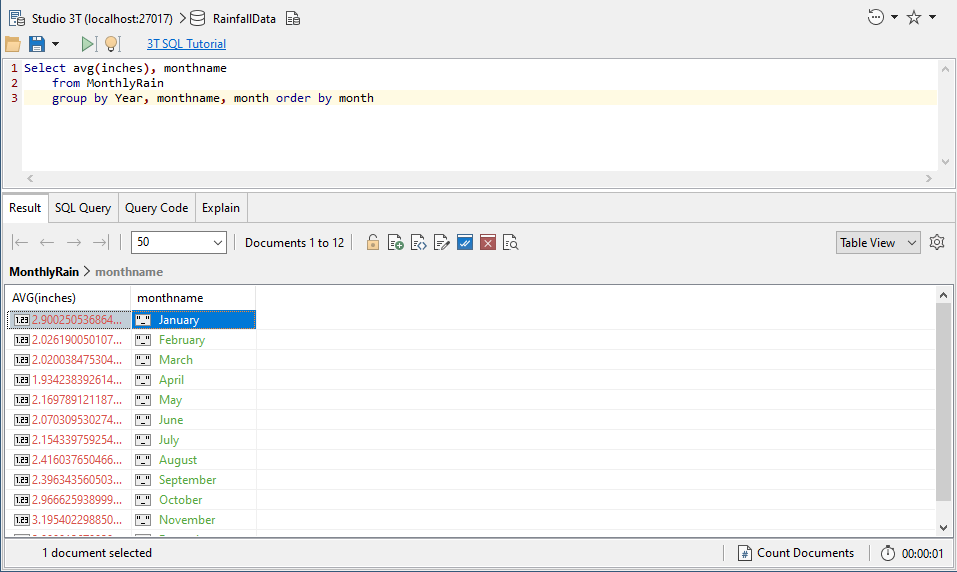
… or the average rainfall per month!
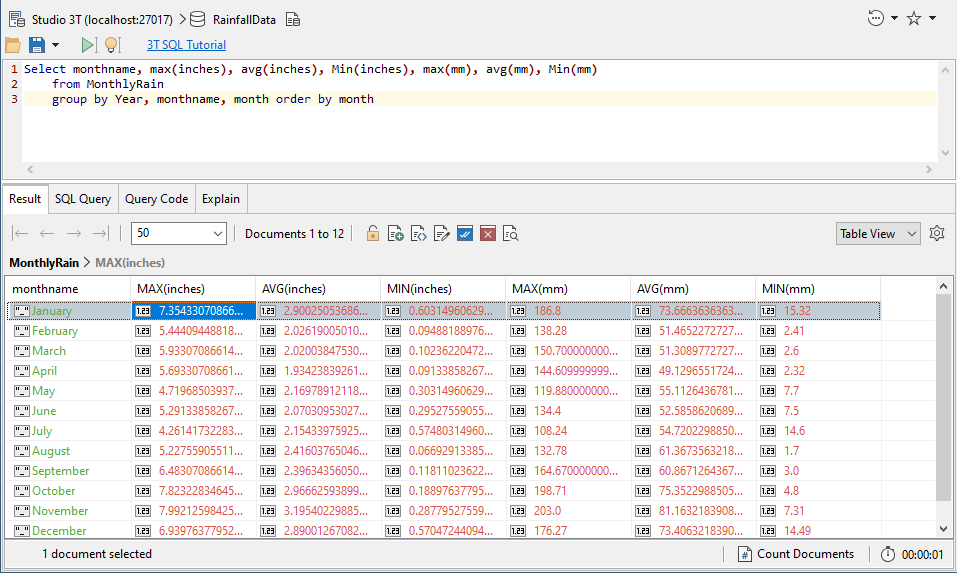
Or, onwards and upwards, a chart of maximum, minimum and average rainfall, represented as both millimetres and inches.
It is possible to use a view to prepare the way for far simpler table-like collections that are much easier for the SQL interpreter to use.
We can’t use SQL code in a view, but we can copy the underlying MongoDB aggregation query below – automatically generated through Query Code – and create a view from it.
use RainfallData;
db.MonthlyRain.aggregate(
    [
        {
            "$group" : {
                "_id" : {
                    "Year" : "$Year",
                    "monthname" : "$monthname",
                    "month" : "$month"
                },
                "MAX(inches)" : {
                    "$max" : "$inches"
                },
                "AVG(inches)" : {
                    "$avg" : "$inches"
                },
                "MIN(inches)" : {
                    "$min" : "$inches"
                },
                "MAX(mm)" : {
                    "$max" : "$mm"
                },
                "AVG(mm)" : {
                    "$avg" : "$mm"
                },
                "MIN(mm)" : {
                    "$min" : "$mm"
                }
            }
        },
        {
            "$project" : {
                "_id" : NumberInt(0),
                "monthname" : "$_id.monthname",
                "MAX(inches)" : "$MAX(inches)",
                "AVG(inches)" : "$AVG(inches)",
                "MIN(inches)" : "$MIN(inches)",
                "MAX(mm)" : "$MAX(mm)",
                "AVG(mm)" : "$AVG(mm)",
                "MIN(mm)" : "$MIN(mm)",
                "month" : "$_id.month"
            }
        },
        {
            "$sort" : {
                "month" : NumberInt(1)
            }
        },
        {
            "$project" : {
                "_id" : NumberInt(0),
                "monthname" : "$monthname",
                "MAX(inches)" : "$MAX(inches)",
                "AVG(inches)" : "$AVG(inches)",
                "MIN(inches)" : "$MIN(inches)",
                "MAX(mm)" : "$MAX(mm)",
                "AVG(mm)" : "$AVG(mm)",
                "MIN(mm)" : "$MIN(mm)"
            }
        }
    ]
);
Summary
When you are designing a MongoDB database, it is likely that you will soon reach the stage where you will go beyond the base collection to provide views and data aggregations.
In this article, I’ve given you a practical demonstration of views to supplement the data aggregation techniques I illustrated in Using Aggregation and Regex in MongoDB to Reduce Data in a Collection and MongoDB, A Database with Porpoise.
When should you use a view rather than a data aggregation? Basically, views are best where data is ‘ín motion’, likely to change at any moment, and it is essential to get the data as it is, whereas data aggregations are for static and historic data that is the bedrock of reporting. They both hide complexity from the application, decouple the development of the application and database, increase the opportunity for security and data masking, make tuning easier, and make it easier to put more complex code in one place only.